Chartbook on Disability in New York State, 1998 - 2000
Demographic Characteristics by Disability Status
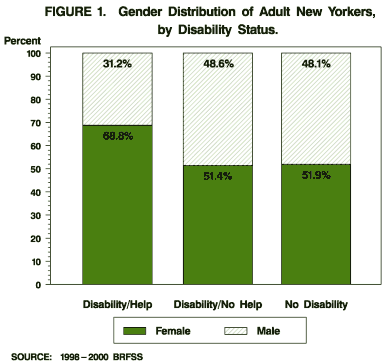
Gender Distribution
The gender distribution within disability subgroups was similar for those with no disabilities (51.4% female) and those with a disability but needing no assistance in performing daily activities (51.9% female). However, women comprised 68.8% of those who needed help with everyday activities. [Appendix B: Table B-1]
The subgroup of persons reporting a greater degree of disability was comprised of a greater proportion of females than the rest of the population.
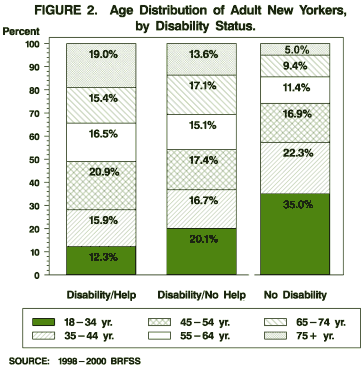
Age Distribution
The age distribution of those with disabilities differed substantially from those who reported no disabilities. Both disability subgroups were generally older than those without disabilities. Persons 65 years and older comprised 30.7% of those needing no assistance and 35.4% of those needing assistance in daily activities, compared to 14.4% of those with no disabilities. In contrast, 35.0% of those with no disabilities were less than 35 years old, compared to 20.1% of those with disabilities requiring no assistance and only 12.3% of those needing assistance. [Appendix B: Table B-1]
Subgroups of persons with disabilities were older than the rest of the population.
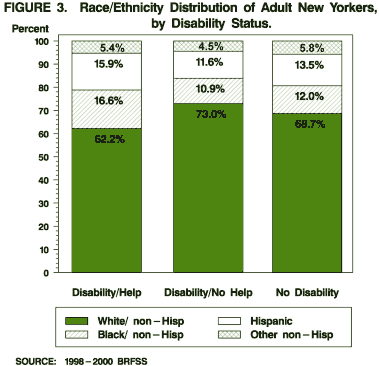
Race/Ethnicity Distribution
The distribution of racial/ethnic categories did not vary greatly across disability subgroups, with one exception. Non-Hispanic whites comprised a significantly smaller percentage of those needing assistance (62.2%) compared to both those needing no assistance (73.0%) and those reporting no disabilities (68.7%). [Appendix B: Table B-1]
The subgroup of persons with disabilities requiring assistance was proportionately less likely to be non-Hispanic whites than either the subgroup needing no assistance or those with no disabilities.
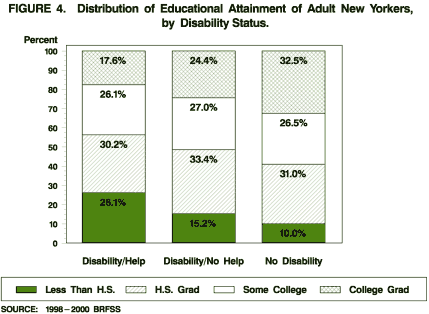
Educational Attainment Distribution
The disability subgroups varied in the distribution of highest educational level attained. In general, those with disabilities were a less-educated subgroup than the rest of the population. Nearly a third (32.5%) of those with no disabilities reported being college graduates, compared to 24.4% of those with a disability needing no assistance and 17.6% of those needing assistance. About a quarter (26.1%) of those needing assistance reported having less than a high school education. [Appendix B: Table B-1]
People with disabilities were proportionately less likely to be college graduates and more likely to have less than a high school education.
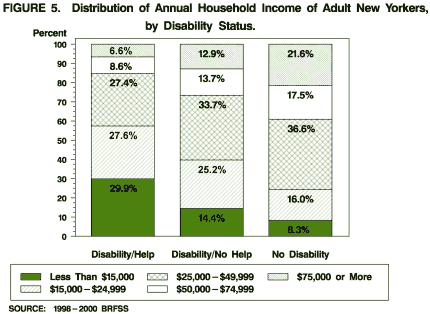
Household Income Distribution
The distribution of annual household income varied substantially by disability status, a relationship clearly related to the educational attainment of the subgroups. Among persons with disabilities, 57.4% of those needing assistance and 39.7% of those needing no assistance reported an income of less than $25,000. However, only about a quarter (24.3%) of those with no disabilities reported earning less than $25,000. Also, 39.1 % of those with no disabilities reported an annual income of at least $50,000, compared to 15.2% of the subgroup needing assistance. [Appendix B: Table B-1]
Persons with disabilities were more likely to report annual household income of less than $25,000 and less likely to report income of $50,000 or more.
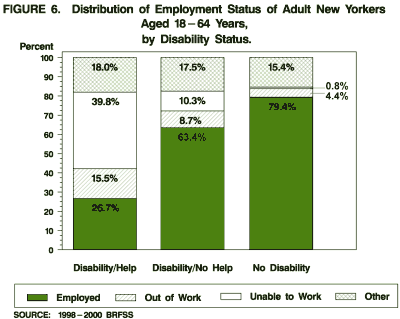
Employment Distribution
Among working-age adults (aged 18-64 years), persons with disabilities were far less likely to be employed, either for wages or self-employed, than the rest of the population. A large majority (79.4%) of those without disabilities were currently employed, compared to 63.4% of those with disabilities not requiring assistance and 26.7% of those needing assistance. Moreover, 39.8% of those with disabilities requiring help reported being unable to work, compared to only 0.8% of adults with no disabilities. [Appendix B: Table B-1]
Working-age adults with disabilities were less likely to be employed than were adults without disabilities.