Chartbook on Disability in New York State, 1998 - 2000
Prevalence of Disability
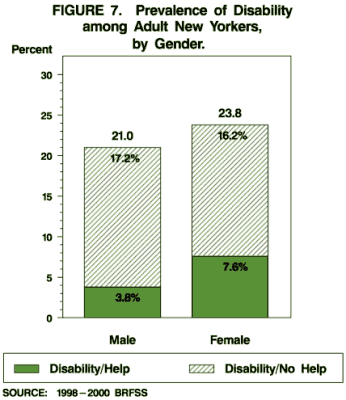
Prevalence by Gender
Although the overall prevalence of disability was similar for males and females (21.0% vs. 23.8%, respectively), females were more than twice as likely as males (7.6% vs. 3.8%, respectively) to have responded as needing assistance in performing routine and/or personal care activities. [Appendix B: Table B-2]
Females with disabilities were twice as likely as males with disabilities to need assistance in performing daily activities.
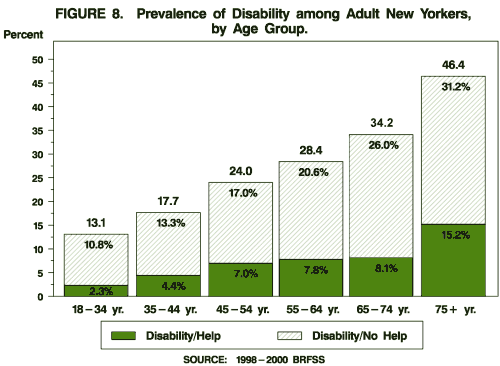
Prevalence by Age
Prevalence was found to vary directly by age within both subgroups of disability. Within the group who reported needing assistance with daily activities, the prevalence ranged from 2.3% among those aged 18-34 years of age to 15.2% among those aged 75 years and older. Among those who needed no assistance, the range was 10.8% (ages 18-34 years) to 31.2% (ages 75+ years). [Appendix B: Table B-2]
Disability prevalence increased with age.
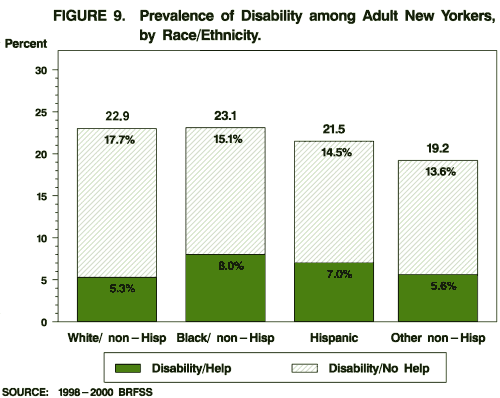
Prevalence by Race/Ethnicity
Non-Hispanic whites (22.9%) and non-Hispanic blacks (23.1%) reported the highest overall rates of disability. The two subgroups differed, however, in the proportion reporting the need for assistance in daily activities, as 8.0% of non-Hispanic blacks fell into this category compared to 5.3% of non-Hispanic whites. [Appendix B: Table B-2]
Non-Hispanic blacks with disabilities were more likely to report a need for assistance in performing daily activities than were non-Hispanic whites with disabilities.
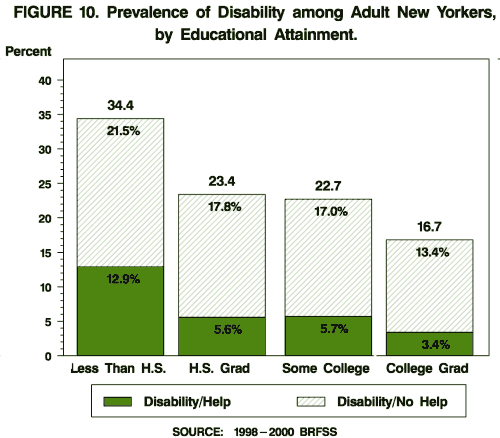
Prevalence by Educational Attainment
Disability prevalence estimates showed an inverse relationship with level of educational attainment: the higher the educational level, the less likely respondents were to report disability. The differences were significant within both categories of disability status. Among those who reported less than a high school education, 12.9% needed help with daily activities and 21.5% needed no help. Among college graduates, the rates were 3.4% and 13.4%, respectively. [Appendix B: Table B-2]
The higher their levels of educational attainment, the less likely respondents were to report disability.
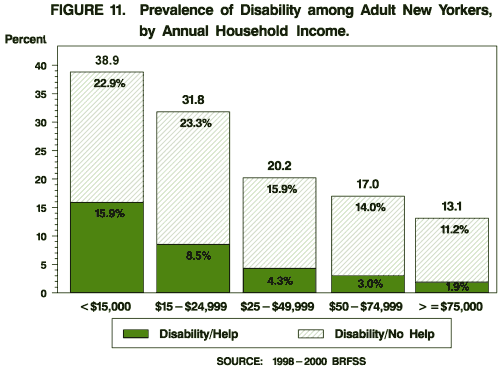
Prevalence by Household Income
In both disability subgroups, the prevalence of disability varied inversely by reported annual household income. Among those earning less than $15,000 yearly, the rates were 15.9% for the subgroup needing assistance and 22.9% for those not needing assistance. In contrast, the corresponding rates among those with a yearly income of $75,000 and over were 1.9% and 11.2%, respectively. [Appendix B: Table B-2]
Disability prevalence decreased with increasing household income.