Chartbook on Disability in New York State, 1998 - 2000
Health Risk Factors
Behavioral risk factors consist of personal decisions and habits that affect one’s health and over which one has considerable control.1 Despite the fact, however, that interventions aimed at promoting more healthful behaviors among the population may prevent or decrease disability, such health-damaging behaviors are extremely resistant to permanent change.21
Risk-reducing, health-promoting activities are especially important for the elderly with chronic disease because they are already predisposed to functional limitation and disability.1 Adopting healthful behaviors even late in life can be beneficial, perhaps preventing the progression of impairments to functional limitations and disability. A number of behavioral risk factors have been found to be predictors of disability onset, including smoking, lack of exercise, and excess weight. Smoking has been associated with mobility loss, even after adjustment for presence of chronic conditions. Lack of exercise has also been demonstrated to place individuals at increased risk of disability, whereas decreased risk has been shown in those who are physically active. In addition, the risk of mobility loss in individuals who are overweight has been clearly demonstrated.22
In this section, four modifiable behavioral risk factors are presented by disability status. The data on smoking behavior came from the questions included in the Tobacco Use module from 1998 to 2000. Questions on the height and weight of respondents, included in the BRFSS demographic section, have enabled the calculation of body mass index (BMI, kg/m 2 ). In the charts that follow, BMI has been categorized into subgroups of "overweight" (BMI≥25.0<30.0) and "obese" (BMI≥30.0). The information on recent leisure-time exercise or physical activity came from an item included in the BRFSS Exercise module in 1998 and 2000. Lastly, the questions assessing fruit and vegetable consumption comprised a module on the 1998 and 2000 BRFSS questionnaires.
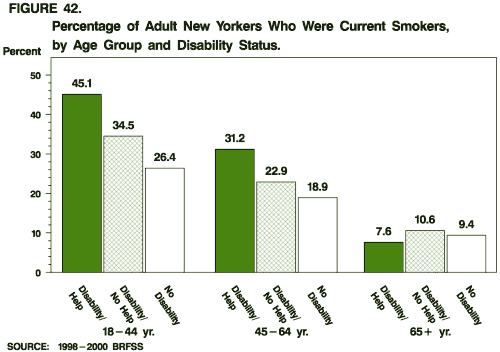
Smoking
Questions: Have you smoked at least 100 cigarettes in your entire life? [If "yes"] Do you now smoke cigarettes everyday, some days, or not at all?
The prevalence of current cigarette smoking behavior differed by disability status among working-age respondents. The variation was most striking among those aged 18-44 years, as 45.1% of those needing assistance reported being current smokers, compared to 34.5% of those needing no help and 26.4% of those with no disabilities. Smoking behavior was generally low among elderly respondents, regardless of disability status. [Appendix B: Table B-11]
Working-age persons with disabilities, especially those requiring assistance, were more likely to be current smokers than were those with no disabilities.
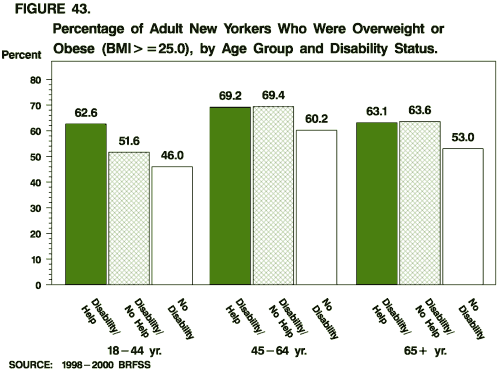
Overweight or Obese
Questions: About how much do you weigh without shoes? About how tall are you without shoes?
Persons with disabilities were more likely to be overweight or obese (body mass index [BMI] of 25.0 or greater) than were respondents without disabilities. (BMI is calculated as weight in kilograms divided by height in meters squared [weight (kg)/height squared (m 2 )].) The difference persisted across age groups, but was greatest among those aged 18-44 years. In this age group, 62.6% of those needing assistance were found to be overweight or obese, compared to 46.0% of those without disabilities. [Appendix B: Table B-11]
Persons with disabilities were more likely to be overweight or obese than were those with no disabilities.
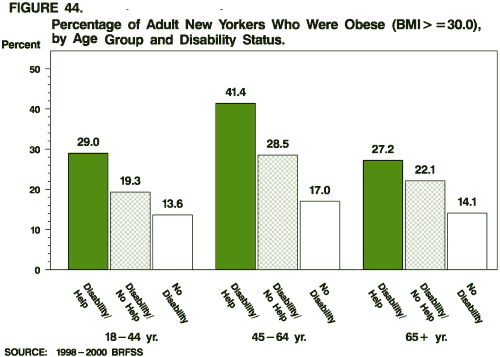
Obesity
Questions: About how much do you weigh without shoes? About how tall are you without shoes?
Persons with disabilities were more likely than those without disabilities to be obese (body mass index [BMI] of 30.0 or greater), regardless of age. Moreover, among persons with disabilities, those requiring assistance were more likely to be obese than those not needing assistance. These relationships were found across all age groups, but were especially evident among those aged 45-64 years, as 41.4% of those needing assistance were obese compared to 28.5% of those not needing assistance and 17.0% of those without disabilities. [Appendix B: Table B-11]
Persons with disabilities, especially those requiring assistance, were more likely to be obese than were those with no disabilities.
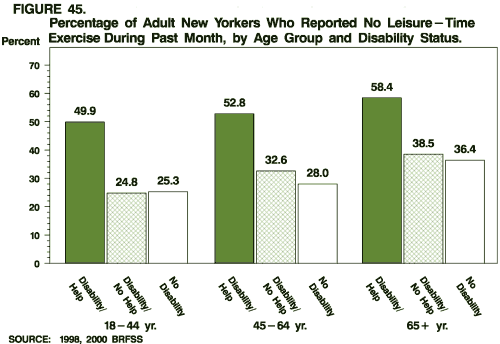
Lack of Physical Activity
Question: During the past month, did you participate in any physical activities or exercises such as running, calisthenics, golf, gardening, or walking for exercise?
Persons with disabilities requiring assistance were less likely to report any type of recent leisure-time exercise or physical activity compared to the rest of the population. This difference persisted across all age groups. [Appendix B: Table B-11]
Compared to the rest of the population, persons with disabilities requiring assistance were less likely to report participation in recent leisure-time exercise or physical activity.
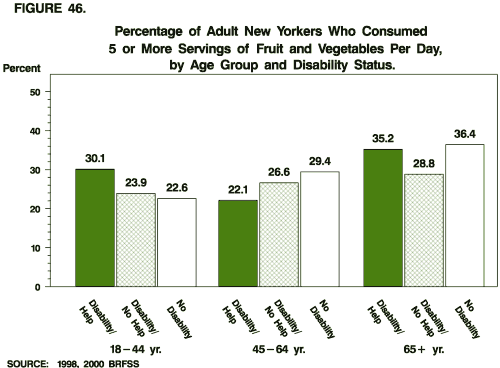
Fruit and Vegetable Consumption
Questions: How often do you drink fruit juices such as orange, grapefruit, or tomato? Not counting juice, how often do you eat fruit (per day, week, month, year)? How often do you eat green salad? How often do you eat potatoes not including french fries, fried potatoes, or potato chips? How often do you eat carrots? Not counting carrots, potatoes, or salad, how many servings of vegetables do you usually eat (per day, week, month, year)?
There were no consistent differences by disability status in the percentage of respondents who reported consuming five or more servings of fruits and vegetables daily. In the youngest age group (18-44 years), those with disabilities requiring assistance were slightly more likely than those without disabilities to report this consumption (30.1% vs. 22.6%, respectively). However, in the older age group (65+ years), persons with disabilities not requiring assistance were slightly less likely than those with no disabilities to consume five or more servings per day (28.8% vs. 36.4%, respectively). In general, fruit and vegetable consumption increased with age, regardless of disability status. [Appendix B: Table B-11]
In general, there were no differences by disability status in the daily consumption of five or more servings of fruits and vegetables.