Strengthening New York's Public Health System for the 21st Century
REPORT OF THE PUBLIC HEALTH INFRASTRUCTURE WORK GROUP TO THE PUBLIC HEALTH COUNCIL
APPENDIX D NEW YORK STATE DEMOGRAPHIC PROFILE
According to the 2000 Census, New York State was home to almost 19 million (18,976,457) people. This was an increase of 5.5% over the 1990 population. New York City contained more than 42% of the State's population with over 8 million (8,008,276) residents. This was a 9.4% increase from 1990. An additional 23% of the State's population resided in the six counties closest to New York City, all of which experienced at least moderate growth since 1990.
There is a wide variation in population density across New York State. New York County (Manhattan) has the highest population density of 54,900 people per square mile, while Hamilton County (Adirondack Region) has the lowest density of only 3 people per square mile. About 26% of New Yorkers live in rural areas, compared to 36% nationwide.
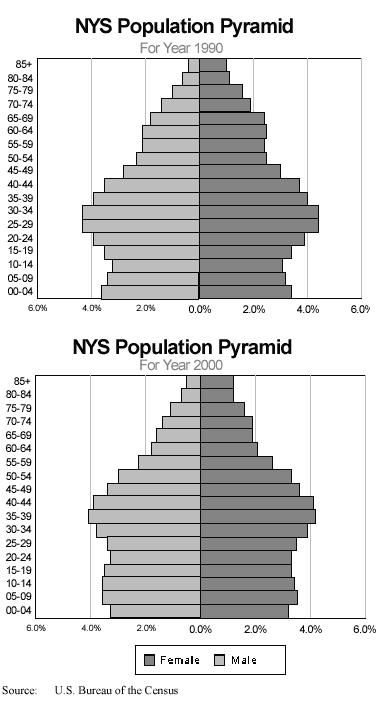
Of New York's 2000 population, 4.7 million (24.7%) were under 18 years of age; 11.9 million (62.4%) were 18 to 64 years of age, and 2.4 million (12.9%) were 65 years of age or older. The median age has increased from 30.3 years in 1970, to 32.0 years in 1980, to 33.8 years in 1990 to 35.9 years in 2000. This increase reflects the aging of the "Baby Boomers" born between 1946 and 1964, as well as the longer survival rates of the elderly. The increase in the median age also reflects a change in age distribution towards the older ages, as seen in the 1990 and 2000 population pyramids in Figure 1 presented below.

The life expectancy at birth for New York State residents has increased from 75.2 years in 1991 to 78.1 years in 2000.
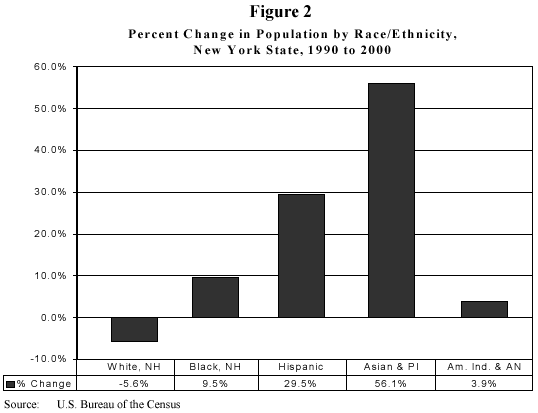
New York State's population reflects diverse race and ethnicity. New York has higher percentages of non-Hispanic Black residents, Hispanic residents, and non-citizen immigrant residents than the US average. According to the 2000 Census, 15.9% of New York State's population identify themselves as Black or African American alone, 67.9% reported they were Caucasian only, 5.5% stated they were Asian alone, 0.4% reported they were American Indian and 0.05% reported that they were Native Hawaiian or Pacific Islander. Statewide, 2,867,583 individuals reported that they were of Hispanic origin; 15.1% of the total population. This population grew by 29.5% between 1990 and 2000. As seen below in Figure 2, the number of non-Hispanic Blacks also grew during the same time period, albeit at a lower rate of 9.5%. The Asian population surged by 56.1% to over one million (1,035,926). The diversity of New York's population is also underscored by the 3.1% of the total population who identified themselves as being of more than one race in 2000.
New York State's cultural diversity has also led to language diversity. Of the 17,749,110 New Yorkers over 5 years of age, an estimated 28.0% speak a language other than English and 13.0% speak English less than "very well"; about 13.6% of New Yorkers speak Spanish at home. According to the NY State Education Department, of its 3.34 million students who attended public school in 1999, 7.6% were identified as limited English proficient.

Trends, based on the Bureau of Census's Current Population Survey, have shown a reduction in New York's population below Federal poverty levels from 18.4% in 1993 to 14.1% in 1999. The 2000 Census figure of 14.6% for New York is higher than the National average of 12.4%. These data also show New York as having higher poverty rates compared to the nation for families (11.5% vs. 9.2%), children less than 18 years of age (19.6% vs. 16.1%) and adults 65 years of age and older (11.5% vs. 9.2%). New York also shows a greater range in the percent of population below poverty across its counties, from highs of 30.7% in Bronx and 25.1% in Kings counties to lows of 4.4% in Putnam and 5.2% in New York counties.
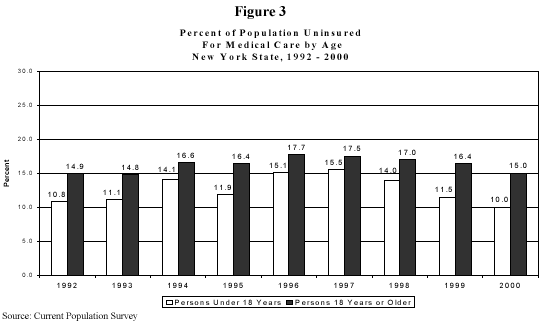
Poverty is often associated with access to medical care. Information from the Current Population Survey shows that while the percent of New Yorkers uninsured for medical care rose in the mid90s, the availability of Child Health Plus (New York's low cost health insurance program for the uninsured and underinsured children) and an expansion of Medicaid have changed this trend. For children less than 18 years of age the proportion of uninsured dropped from 15.5% in 1997 to 14.0% in 1998 to 11.5% in 1999 to 10% in 2000. Similar proportions are seen for New Yorker's 19 years of age and older (17.5% in 1997, 17.0% in 1998, 16.4% in 1999 and 15.0% in 2000). See Figure 3 below.
