HEDIS Measures for the Medical Record Review Process
NY DSRIP HEDIS® Measure Reporting
October 2015
- Process also available in Portable Document Format (PDF)
Six HEDIS® Hybrid Measures for PPS Reporting
- Controlling High Blood Pressure (CBP)
- Comprehensive Diabetes Care (CDC)
- Prenatal and Postpartum Care (PPC)
- Frequency of Ongoing Prenatal Care (FPC)
- Childhood Immunization Status (CIS)
- Lead Screening in Children (LSC)
Two non–HEDIS® measures for PPS Reporting
- Screening for Clinical Depression (SCD)
- Viral Load Suppression (VLS)
What is HEDIS®?
HealthCare Effectiveness Data & Information Set
- A collective summary of an organization´s annual performance
- Developed by the National Committee for Quality Assurance
- Measurement protocol for the healthcare delivery system, reported by more than 90% of health plans in the U.S.
- 88 measures across 7 domains of care
How is HEDIS® Used?
Nationally
Quality Compass – comparison of health plans regionally and nationally Component of MCO accreditation Medicare Advantage plans must report performance for CMS Star rating system US News and World Report– annual ranking of health plans
New York
Public Reporting
- Annual Managed Care performance – eQARR
- Access and utilization report
- Medicaid consumer guides
Quality Improvement
- Quality improvement matrices
- Focus studies/performance improvement projects Financial Incentives (Medicaid)
- Auto–assignment preference
- Value–based purchasing (in development)
- Quality incentive
Financial Incentives (Medicaid)
- Auto–assignment preference
- Value–based purchasing (in development)
- Quality incentive
Glossary of Terms
- Eligible Population (EPOP): target population (denominator) minus exclusions who could potentially receive the service
- Numerator: all who receive the service
- Denominator: the target population
- Exclusions: those in the EPOP who should not receive the service (required or optional)
- Continuous Enrollment: period of time needed to ensure ample opportunity for the service to be provided
- Enrollment Gap: allowable time not enrolled to maximize the size of the EPOP
- Look Back Period: time period prior to the measurement period to calculate the measure
- e.g., Persons with diabetes can be identified in the year prior to the measurement year
- e.g., For the timeliness of prenatal care measure, 280 days prior to delivery identifies the first trimester
Creating HEDIS® Measures
| Claims | Provider | Patient | ECDS | Vendor | Medical Record |
Supplemental Data Sources |
| ↓ | ↓ | ↓ | ↓ | ↓ | ↓ | ↓ |
| HEDIS® Warehouse | ||||||
| Numerator/Denominator * 100 (higher results = "better" performance) | ↓ | Rates: number of events per 1,000 members | ||||
| HEDIS® Measures | ||||||
Controlling High Blood Pressure
Controlling High Blood Pressure Specifications
Description: Percentage of Medicaid members 18–85 years of age who had a diagnosis of hypertension (HTN) and BP effectively controlled during the MY.
Numerator: Members with effective BP control during the MY as defined by the following criteria:One rate is reported, and is the sum of all three groups.
- Members 18–59 years of age whose BP was <140/90 mm Hg
- Members 60–85 years of age with a diagnosis of diabetes whose BP was <140/90 mm Hg
- Members 60–85 years of age without a diagnosis of diabetes whose BP was <150/90 mm Hg
Denominator: Members aged 18 to 85 years, who have hypertension confirmed by the medical record. There is a flag for members with and without diabetes.
Exclusions (optional): Members with ESRD or kidney transplant on or prior to June 30th, 2015. Pregnant members during MY. Non–acute inpatient admission during MY.
| MMC Plan eQARR 2014 Rates 1 | Controlling High Blood Pressure |
|---|---|
| NY Statewide Average | 63% |
| National Average | 56% |
____________________________________
1. eQARR 2014
Controlling High Blood Pressure Importance of the Topic
- Heart disease is the leading cause of death for both men and women. Every year about 610,000 people die of heart disease in the United States–that´s 1 in every 4 deaths2
- Hypertension is a major modifiable risk factor for cardiovascular disease3
- Approximately 50% of US adults reported to have inadequately controlled hypertension
- Estimated annual national cost is $51 billion
____________________________________
2. CDC, NCHS. Underlying Cause of Death 1999–2013 on CDC WONDER Online Database, released 2015. Data are from the Multiple Cause of Death Files, 1999–2013, as compiled from data provided by the 57 vital statistics jurisdictions through the Vital Statistics Cooperative Program. Accessed Feb. 3, 2015.
3. CDC Million Hearts Campaign. Blood pressure toolkit. http://millionhearts.hhs.gov/tools-protocols/tools.html
Controlling High Blood Pressure Relevance to DSRIP Goals
- Heart disease is the leading cause of death for NY Medicaid–enrollees, with hypertension among the top ten causes of death
- NYS Prevention Agenda goal to promote evidence–based care to manage chronic disease, specifically blood pressure control.
- Blood pressure management requires engagement of delivery system, patients, providers and communities.
- Medication–prescribing, adherence, patient–provider communication, team–based care
- Multidisciplinary teams to facilitate lifestyle changes
- Million Hearts Campaign Hypertension Control Change Package
- Establish practice foundations for hypertension control
- Population health management
- Patient supports
More than half (56%) of the PPSs are participating in a project to address cardiovascular disease (3.b.i and 3.b.ii)
CDC. Hypertension control change package for clinicians. https://millionhearts.hhs.gov/files/HTN_Change_Package.pdf
NYSDOH OQPS Leading causes of death 2012, New York State http://www.health.ny.gov/statistics/vital_statistics/docs/leading_causes_of_death_nys_2012.pdf
Comprehensive Diabetes Care
Comprehensive Diabetes Care Specifications
Description: Percentage of members aged 18–75 years of age with diabetes (type 1 and type 2) during the MY or the year prior who had following
- (4 numerators):
- HbA1c test performed
- HbA1c poor control >9% (lower rate is desirable)
- Dilated eye exam
- Medicaid attention for nephropathy
- Denominator: Members 18–75 as of June 30th, identified as having diabetes (either by claim/encounter data or by pharmacy data), continuously enrolled with no more than 1 gap of up to 45 days
Exclusions (optional): Non–diabetic members who either had polycystic ovaries anytime in their medical history through June 30th, 2015, or had a diagnosis of gestational diabetes or steroid–induced diabetes during the MY or year prior.
| MMC Plan eQARR Rates 1 | HbA1c Testing | HbA1c Poor Control* | Dilated Eye Exam | Nephropathy Monitoring |
|---|---|---|---|---|
| MMC NYS Average | 89% | 32% | 63% | 83% |
| National Average | 84% | 46% | 54% | 79% |
* Lower rate is desirable
____________________________________
1. eQARR
Comprehensive Diabetes Care Importance of the Topic
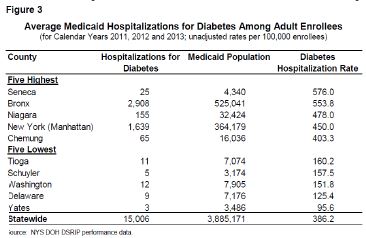
- Diabetes prevalence in New York is increasing.
- Higher rates of hospitalization and hospital care exist among those with diabetes
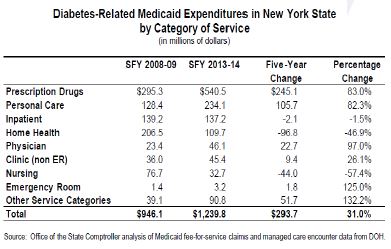
- Diabetes–related costs for Medicaid members in 2013–14 represented about 10% of DOH´s estimated $12 billion in overall diabetes spending in New York.
- Expenditures for Medicaid beneficiaries with diabetes are 3x higher than adult beneficiaries without diabetes, costing nation $245 billion.
- Diabetes is especially costly since 25%–45% of diabetes– attributed medical expenditures were spent treating complications.
Aubert RE, Geiss LS, Ballard DJ, Cocanougher B, Herman WH: Diabetes–related hospitalization and hospital utilization. In Diabetes in America. 2nd ed. Bethesda, MD, National Institutes of Health, 1995, p. 553–570 (NIH publ. no. 95–1468)
Office of the State Comptroller analysis of Medicaid fee–for–service claims and managed care encounter data from DOH. http://content.healthaffairs.org/content/31/1/159.full
American Diabetes Association. Economic costs of diabetes in the U.S. in 2007. Diabetes Care 2008; 31:596–615
American Diabetes Association. Economic Costs of Diabetes in the U.S. in 2012. Diabetes Care36:1033–1046, 2013.
Comprehensive Diabetes Care DSRIP and Clinical Relevance
- DSRIP affords the opportunity for care coordination in order to improve the consistency and quality of care to patients
- A1c is the primary predictor of diabetic complications.
- Optimizing a1c control decreases the risk of microvascular (kidney disease and retinopathy) and cardiovascular complications
- Diabetes self–management education is associated with optimal control
- Monitoring A1C and screening for retinopathy and nephropathy allows for early identification and relevant interventions for these conditions
- 44% of the PPSs are participating in a DSRIP project to address Diabetes care (3.c.i and 3.c.ii)
American Diabetes Association. Standards of medical care for diabetes. 2015. http://care.diabetesjournals.org/content/38/Supplement_1
Prenatal and Postpartum Care
Prenatal and Postpartum Care Specifications
Description: Percentage of live birth deliveries between May 6th to May 5th of the following year, including:
- Timeliness of Prenatal Care:
- Numerator: the percentage of deliveries that received a prenatal care visit as a member in the first trimester or within 42 days of enrollment in Medicaid.
- Postpartum Care:
- Numerator: the percentage of deliveries that had a postpartum visit on or between 21 and 56 days after delivery.
- Denominator: Medicaid members who delivered a baby in the last year, continuously enrolled 43 days prior to the delivery through 56 days after delivery.
Exclusion: Non–live births
| MMC Plan eQARR Rates1 | Prenatal Care in the First Trimester | Risk–Adjusted Low Birthweight (LBW)* | Risk–Adjusted Primary Cesarean Delivery* | Vaginal Birth After Cesarean Section (VBAC) |
|---|---|---|---|---|
| Statewide Average | 72.0% | 6.6% | 16.0% | 14.3% |
* Lower rate is desirable
____________________________________
1. eQARR 2014
Prenatal and Postpartum Specifications
Prenatal care visit to an OB/GYN or PCP with diagnosis of pregnancy. Medical record must include the date and one of the following:
- A basic physical obstetrical exam that includes auscultation for fetal heart tone, or pelvic exam with obstetric observations, or measurement of fundus height.
- Evidence a prenatal care procedure was performed: screening test in the form of an obstetric panel, or TORCH antibody panel alone, or a rubella antibody test/titer with an Rh incompatibility (ABO/Rh) blood typing, or echography of a pregnant uterus
- Documentation of LMP or EDD in conjunction with either prenatal risk assessment and counseling/education or complete obstetrical history
Postpartum visit to an OB/GYN practitioner or midwife, family practitioner or other PCP on or between 21 and 56 days after delivery.
Medical record must include the date and one of the following:
- Pelvic exam
- Evaluation of weight, BP, breasts and abdomen
- Notation of postpartum care, including, but not limited to notation of "postpartum care," "PP care," "PP check," "6–week check," or a preprinted "Postpartum Care" form in which information was documented during the visit
Prenatal and Postpartum Care Clinical Relevance and Importance
- Late initiation of prenatal care is associated with increased risk for adverse outcomes
- Delayed identification of complications
- Delayed evidence–based interventions for prevalent risk factors among Medicaid–enrolled women
- Tobacco cessation
- 17α–hydroxyprogesterone caproate for prior preterm
- Appropriate gestational weight gain for overweight/obese women
- Aspirin prophylaxis for women at high risk for preeclampsia
- Postpartum care is essential for maternal and infant health and positive outcomes for subsequent pregnancies
- Follow–up of pregnancy–associated conditions
- Reproductive planning for appropriate birth spacing
- Initiation of inter–conception care
Prenatal and Postpartum Care DSRIP and Clinical Relevance
PPSs can facilitate coordination of care and patient adherence to visits and treatment plans to ensure optimal outcomes.
Prenatal
- Facilitate timely access to appropriate prenatal providers
- Coordinate providers for optimal management of chronic conditions and behavioral risks, such as obesity, depression and tobacco dependence
- Target high risk subpopulations for ongoing support
Postpartum
- Facilitate follow–up assessment and care of pregnancy–associated and chronic conditions, such as diabetes screening, evaluation of hypertension
- Facilitate the initiation of inter–conception care and appropriate birth spacing
- Coordinate reproductive planning by hospitals and postpartum providers
- Postpartum weight management programs for overweight and obese women
- Linkage to ongoing care for chronic conditions
16% of the PPSs are participating in project 3.f.i to address Prenatal and Postpartum care
Frequency of Ongoing Prenatal Care
Frequency of Ongoing Prenatal Care Specifications
Description: Percentage of Medicaid deliveries between May 6th to May 5th of the following year that had ≥81% of expected visits
Numerator: women who had ≥81% of the expected amount of prenatal care visits that were unduplicated, adjusted for the month the member enrolled in Medicaid and gestational age(GA). GA defined as the number of completed weeks that elapsed between the first day of the last normal menstrual period (LMP) and the date of delivery.
Denominator: same as the Prenatal and Postpartum Care measure (Medicaid members who delivered a baby who were continuously enrolled 43 days prior to the delivery through 56 days after delivery)
Exclusion: Non–live births
Frequency of Ongoing Prenatal Care Relevance to DSRIP
- Adequate prenatal care ensures early risk identification and management for optimal outcomes
- PPSs can facilitate coordination of appropriate resources for
- Timely testing for risks associated with adverse outcomes (e.g. asymptomatic bacteriuria, diabetes and Group B strep screening)
- Assessment, monitoring and self–management of chronic and pregnancy–associated conditions (e.g. diabetes, hypertensive disorders)
- Monitoring and interventions for psychosocial risks (e.g. smoking, depression, intimate partner violence)
- Appropriate gestational weight gain
- Adherence to treatment plans
- Patient self–management
16% of the PPSs are participating in project 3.f.i to address Prenatal and Postpartum care
https://www.nichd.nih.gov/health/topics/pregnancy/conditioninfo/Pages/prenatal–care.aspx
U.S. Department of Health and Human Services, Agency for Healthcare Research and Quality, "National Quality Measures Clearing House," accessed October 1, 2014,
AAP/ACOG Guidelines for Perinatal Care, 6th Edition 2007
Childhood Immunization Status
Childhood Immunization Status Specifications
Description and eligible population: The percentage of Medicaid children who turn 2 during the MY who received the immunizations outlined in the table below (i.e., combo 3) by their 2nd birthday. These children must have been enrolled in Medicaid for 12 continuous months with a gap of no more than 45 days.
| Immunization | Count |
|---|---|
| Diphtheria, Tetanus and acellular Pertussis (DTaP) | 4 |
| Polio (IPV) | 3 |
| Measles, Mumps and Rubella (MMR) | 1 |
| Haemophilus Influenza Type B (HiB) | 3 |
| Hepatitis B (HepB) | 3 |
| Chicken Pox (VZV) | 1 |
| Pneumococcal Conjugate (PCV) | 4 |
Numerator:
- For all 7 immunizations, count evidence of the antigen or combination vaccine
- For MMR, HepB, and VZV can also count history of the illness or seropositive test result
| MMC Plan eQARR Rates 1 | Combo 3 |
|---|---|
| MMC NYS Average | 73% |
| National Average | 71 % |
Exclusions (optional): Exclude children who had a contraindication for a specific vaccine from the denominator for all antigen rates and the combination rates. The denominator for all rates must be the same.
____________________________________
1. eQuarr 2014
Childhood Immunization Status DSRIP and Importance of Topic
Consistent with DSRIP goal of improving child health through the first two years of life
- Vaccines are among the most cost–effective clinical preventive services
- Immunizations provide a defense against a host of common diseases that can cause severe illness or death, and lead to avoidable hospitalization
- Nationally, for each birth cohort vaccinated with the routine immunization schedule (this includes DTap, Hib, IPV, MMR, HepB, and VZV):
- 33,000 lives are saved
- 14 million cases of disease are prevented
- $9.9 billion in direct health care costs are reduced
- $33.4 billion in indirect costs are saved
- Nationally, for each birth cohort vaccinated with the routine immunization schedule (this includes DTap, Hib, IPV, MMR, HepB, and VZV):
Consistent with NYSDOH Prevention Agenda, Focus Area 2: Child Health
- Objective to increase the proportion of NYS children who receive key recommended preventive health services as part of routine well–child care by December 31, 2017
- Indicator specific to CIS measure: increase percentage of 19–35 month–olds who have received the Combination 3 vaccines to 80% by 2017
Healthy People 2020, http://www.healthypeople.gov/2020/topics–objectives/topic/immunization–and–infectious–diseases
https://www.health.ny.gov/prevention/prevention_agenda/2013–2017/plan/wic/focus_area_2.htm#g4.3
Lead Screening in Children
Lead Screening in Children Specifications
Description: Percentage of children who had one or more capillary or venous lead blood tests for lead poisoning by their 2nd birthday
Numerator: At least one lead capillary or venous blood test on or before the child´s 2nd birthday as documented through either administrative data or medical record review, including test date and result or finding
Denominator: children who turn 2 during the MY, with 12 months continuous enrollment in Medicaid with a gap of no more than 45 days
| MMC Plan eQARR Rates1 | Lead Screening in Children |
|---|---|
| MMC NYS Average | 87% |
| National Average | 66% |
____________________________________
1. eQuarr 2014
Lead Screening in Children DSRIP and Clinical Relevance
- Any level of lead in blood levels can have adverse effects1
- Blood lead level testing is required for children 12–24 months
- Children with blood lead levels of 5 µg/dL or higher require ongoing monitoring
- Blood lead levels less than 10 µg/dL have been associated with adverse health effects (e.g. IQ deficits, attention–related behaviors, and academic achievement, cardiovascular, endocrine, and immunologic effects)
- New York State children are particularly at risk2
- More pre–1950 housing containing lead paint than any other state
- Risk assessment is recommended annually for all children 6 months to 6 years
____________________________________
1. ACCLPP Report. Low level lead exposure harms children: a renewed call for primary prevention. Available at: http://www.cdc.gov/nceh/lead/acclpp/blood_lead_levels.htm
2. New York State Lead Poisoning Prevention Program. Information for health care providers. https://www.health.ny.gov/environmental/lead/health_care_providers/index.htm
Domain 3 Clinical Improvement Metrics
| Measure Name | Performance Goal | NYS QARR 2014 Rates |
|---|---|---|
| Prenatal and Postpartum Care– timeliness of Prenatal care | 93.9% | 88.0% |
| Prenatal and Postpartum Care—postpartum visits | 81.6% | 70.0% |
| Frequency of Ongoing Prenatal Care (81% or more) | 81.4% | 70.0% |
| Childhood Immunization Status (Combination 3) | 88.4% | 73.0% |
| Lead Screening in Children | 95.3% | 87.0% |
| Comprehensive Diabetes Care (HbA1c testing, dilated eye exam, nephropathy monitoring) | 62.5%* | 51.0%* |
| Comprehensive Diabetes Care– HbA1c poor control (>9%) ± | 23.2% | 32.0% |
| Controlling High Blood Pressure | 73.3% | 63.0% |
* Includes lipid profile
± Lower rate is desirable
Questions
Please send all questions via email to:
DSRIP@health.ny.gov
OR
Please reach out to your Performance Facilitator
OR
Anne Koke, IPRO Project Manager
akoke@ipro.org

Follow Us