NY MRT DSRIP Evaluation Design
- Evaluation Design also available in Portable Document Format (PDF)
Centers for Medicare & Medicaid Services
7500 Security Boulevard, Mail Stop S2–01–16
Baltimore, Maryland 21244–1850
State Demonstrations Group
March 13, 2018
Mr. Jason HelgersonDirector
Office of Health Insurance Programs
New York State Department of Health
Empire State Plaza
Corning Tower (OCP–1211)
Albany, NY 12237
Dear Mr. Helgerson:
The Centers for Medicare & Medicaid Services (CMS) has completed its review of the Delivery System Reform Incentive Payment (DSRIP) Program evaluation design for New York´s section 1115(a) demonstration (Project No. l 1–W–00304/0), entitled "Medicaid Redesign Team" (MRT). We have determined that the submission dated March 9, 2018 meets the requirements set forth in the Special Terms and Conditions and hereby approve the MRT´s DSRIP evaluation design.
If you have any questions, please do not hesitate to contact your project officer, Mr. Adam Goldman. Mr. Goldman can be reached at (410) 786–2242, or at Adam.Goldman@cms.hhs.gov. We look forward to continuing to partner with you and your staff on the MRT demonstration.
Sincerely,
Angela D. Garner
Director, Division of System Reform Demonstrations
Enclosure
cc:
Michael Melendez, Associate Regional Administrator, CMS New York Region
Independent Evaluation of the New York State Delivery System Reform Incentive Payment Program
Updated: March 9, 2018
Table of Contents:
Section A:
Background/Introduction
A.1 Delivery System Reform Incentive Payment Program:
The New York State Delivery System Reform Incentive Payment (DSRIP) Program is the main mechanism by which New York is implementing the Medicaid Redesign Team (MRT) Waiver Amendment. DSRIP´s purpose is to fundamentally restructure the health care delivery system by investing in the Medicaid program, with the primary goal of reducing avoidable hospital use by 25% over five years. Up to $6.42 billion is allocated to this program with payouts based upon achieving predefined results in system transformation, clinical management and population health. DSRIP provides incentives for Medicaid providers to create and sustain an integrated, high performing health care delivery system that can effectively and efficiently meet the needs of Medicaid beneficiaries and low income uninsured individuals in their local communities by achieving the MRT Triple Aim of improving care, improving health, and reducing costs.
Through DSRIP, the New York State Department of Health (NYSDOH) seeks to transform the health care safety net, reduce avoidable hospital use and make improvements in other health and public health measures at the system and state level, and ensure sustainability of delivery system transformation through leveraging managed care payment reform. DSRIP provides incentive payments to reward safety net providers that undertake projects designed to transform systems of care supporting Medicaid beneficiaries and low income, uninsured persons by addressing three key elements: safety net system transformation; appropriate infrastructure; and assuming responsibility for a defined population. Safety net providers who collectively participate in DSRIP are referred to as the 25 regional Performing Provider Systems (PPS).
A.2 DSRIP Evaluation:
An Independent Evaluator (IE), the Research Foundation of the State University of New York (SUNY), is implementing a multi–method, robust statewide evaluation of the DSRIP Program. The evaluation employs quantitative and qualitative methods in order to achieve a robust evaluation of DSRIP, and will achieve the following goals:
- Assess program effectiveness on a statewide level with respect to the MRT Triple Aim;
- Obtain information on the effectiveness of specific projects and strategies selected and the factors associated with program success; and
- Obtain feedback from stakeholders including NYSDOH staff, PPS administrators and providers, and Medicaid beneficiaries served under DSRIP regarding the planning and implementation of the DSRIP Program, and on the health care service experience under DSRIP reforms. Evaluation results will be regularly reported to NYSDOH, the PPS and the Centers for Medicare and Medicaid Services (CMS).
A.3 DSRIP Special Terms and Conditions:
The evaluation will be consistent with the specifications outlined in the DSRIP Special Terms and Conditions (STC), Sections VIII.21 through VIII.33, as outlined in Attachment 1.
A.4 IE Performance Standards/Expectations:
The IE will address the following overarching Research Questions (RQs):
- To what extent did PPS achieve health care system transformation?
- Did health care quality improve as a result of clinical improvements in the treatment of selected diseases and conditions?
- Did population health improve as a result of implementation of the DSRIP initiative?
- Did utilization of behavioral health care services increase as a result of DSRIP?
- Was avoidable hospital use reduced as a result of DSRIP?
- Did DSRIP reduce health care costs?
- What were the successes and challenges with respect to PPS planning, implementation, operation and plans for program sustainability from the perspectives of DSRIP planners, administrators and providers, and why were they successful and challenging?
A.5 Measures and Available Data:
A set of measures described in the "DSRIP Strategies Menu and Metrics" will be used to quantify facets of system transformation (Domain 2), quality of care through clinical improvements (Domain 3), and population health (Domain 4) using existing data sources, described below. Though the IE is not limited to the use of these measures in their evaluation, they may be used for purposes of the DSRIP evaluation in assessing statewide outcomes. The majority of these measures are well established with known measurement stewards (e.g., 3M, AHRQ) and are commonly used in health care quality improvement activities.
Regardless of outcome measures, the IE has access to a number of existing data sources that are maintained by, or are available to, NYSDOH. Given public health law and/or data use agreements that govern access to these data, the IE is aware that obtaining access may require substantial time and effort, which is a consideration of their evaluation timeline.
- Medicaid Claims – This database contains billing records for health care services, including pharmacy, for approximately 5.7 million individuals enrolled in Medicaid in a given year. Also included are data on Medicaid enrollment status, diagnoses and provider associated with the billed services. The Medicaid claims database is updated on a monthly basis to include additional claims and modifications to existing claims. Given the claims processing, there is a six–month lag in the availability of complete and finalized Medicaid claims data, where data for a given year are considered final by June 30 of the following year.
- Medicare Claims – For approximately 15% of Medicaid enrollees who are dually eligible for Medicare, Medicare claims will be used to ensure data completeness, as many of the services received by this group will be paid by Medicare and thus not appear in the Medicaid database. Medicare claims contains billing records for health care services, including pharmacy services, along with data on diagnoses and provider information. NYSDOH is working with an external entity specializing in the linking of Medicaid and Medicare claims data which will ensure timely access to Medicare claims through monthly data updates.
- Statewide Planning and Research Cooperative System (SPARCS) – SPARCS is an all payer data reporting system established in 1979 as a result of cooperation between the health care industry and government. Initially created to collect information on discharges from hospitals, SPARCS currently collects patient level detail on patient characteristics, diagnoses and treatments, services, and charges for inpatient and outpatient (ambulatory surgery, emergency department, and outpatient services), hospital services and outpatient services from free–standing ambulatory surgery centers. SPARCS data may be used for medical or scientific research or statistical or epidemiological purposes. All entities seeking SPARCS identifiable or limited data must submit a request to SPARCS Operations using standard data request forms. Finalized SPARCS data for a given year are available in August of the following year.
- Minimum Data Set (MDS) – MDS 2.0 and 3.0 data consist of federally mandated assessments collected at regular intervals on all nursing home residents in New York. Assessment data collected include diseases and conditions, nutritional status, resident physical and cognitive functioning (e.g., activities of daily living), medications received, and nursing home admission source and discharge disposition. These data have been shown to be adequately reliable and are widely used in research, and are available to NYSDOH under data use agreement with CMS. There is, approximately, a six–month lag in the availability of complete MDS data, where finalized data for a given year are available in June of the following year.
- Consumer Assessment of Healthcare Providers and Systems (CAHPS®) – The Clinician & Group version of the CAHPS® survey will be administered by NYSDOH annually during the DSRIP demonstration period and will serve as the data source for selected outcome measures. The survey is administered by both mail and telephone, and assesses patients´ experiences with health care providers and office staff. This includes information on patient experience over the last 12 months including most recent visit to provider, ease of getting an appointment, and wait times while in the office. The survey includes standardized questionnaires for adults and children. The adult questionnaire can be used in both primary care and specialty care settings; the child questionnaire is designed for primary care settings, but could be adapted for specialty care. Users can also add supplemental items to customize their questionnaires. Surveys are administered in September of a given year, and are available for use in February of the following year. Given confidentiality agreements, only de–identified CAHPS data will be available for use.
- New York Vital Statistics – Birth and death certificate data are maintained by New York, with New York City Department of Health and Mental Hygiene and NYSDOH comprising two separate jurisdictions in the reporting of birth and death records, which will likely necessitate separate data use agreements. NYSDOH has the responsibility for annual statewide reporting of vital statistics governed by the terms of a memorandum of understanding between the two jurisdictions. Birth records contain information such as maternal medical risk factors, prenatal care received, infant birth date, birth weight, and infant diseases/conditions including congenital malformations. Death certificate data include date of death, underlying and multiple cause of death, decedent demographics, county of residence, and county of death. While Vital Statistics data are received by NYSDOH on an ongoing basis, due to the process of updating and finalizing information from birth and death certificates (e.g., due to delayed receipt of lab results), data for a given year are not considered complete until the end of the following year.
- Expanded Behavioral Risk Factor Surveillance System (eBRFSS) – eBRFSS augments the Centers for Disease Control and Prevention (CDC) BRFSS, which is conducted annually in New York. eBRFSS is a random–digit–dialed telephone survey among adults 18 years of age and older representative of the non–institutionalized civilian population with landline telephones or cell phones living in New York. The goal of eBRFSS is to collect county–specific data on preventive health practices, risk behaviors, injuries and preventable chronic and infectious diseases. Topics assessed by the eBRFSS include tobacco use, physical inactivity, diet, use of cancer screening services, and other factors linked to the leading causes of morbidity and mortality. The 2013–14 eBRFSS survey will be used as the baseline for DSRIP for measures derived from these data, and contains a question to identify Medicaid respondents. Repeat eBRFSS surveys to be used in support of the DSRIP evaluation will be conducted in 2016–17, and again in 2019–20.
- New York HIV/AIDS Case Surveillance Registry – This registry contains information on new cases of HIV and AIDS, as well as persons living with HIV or AIDS. Data include date of diagnosis, HIV exposure category, county of residence at diagnosis, and whether or not diagnosis was made while individual was incarcerated.
- Uniform Assessment System (UAS) – UAS contains assessment data on individuals receiving home or community–based long term care (e.g., adult day health care, long term home health care). Data include patient functional status, health status, cognitive functioning, and care preferences.
- US Census – These data are publicly available from the United States (US) Census Bureau, and contain estimates of population size, and data on population characteristics. The latter include housing status, income, employment status, educational level, and health insurance coverage. US census data are gathered on an ongoing basis from a number of surveys including the Decennial Census, the American Community Survey, and the Economic Census.
- Medical Record – Measures that are derived from medical records will be reported by PPS, or their participating providers.
- Medicaid and Medicare Claims – These data, as well as SPARCS data, are available from the Office of Health Insurance Programs (OHIP) Data Mart. Implemented in 1998, the OHIP Data Mart serves as a data repository to support analytical reporting and applications for NYSDOH, the Office of the Medical Inspector General, and the Office of the Attorney General. It supports analytics and ad hoc user queries, and supports a number of projects including Medicaid Claims History, the Medicaid Drug Rebate Application, and MRT Performance Analytics.
The IE will use a mixed methods strategy to meet the project objectives. This strategy offsets the weaknesses inherent in single method approaches and allows them to confirm, cross–validate, and corroborate the findings (Creswell, et al., 2003; Teddlie and Yu, 2007). See Sections B, C and D for more detailed explanations and strategy rationales.
A.6 Study Populations and Sample Sizes:
In November 2017, NYSDOH responded to CMS´s request to present a sampling strategy that explains how the 25 distinct PPS offer a distinct form of the intervention and the intensity of the intervention is expected to vary greatly across the state. CMS suggested the plan provide details on how the treatment and comparison groups will be identified in each data source and what identifiers will be used to match records across sources (e.g., SSN, Medicaid ID, name and address, provider numbers). CMS further stated that the plan should also document the ability to identify attributed or served patients and include a discussion of challenges in obtaining and integrating data and strategies for overcoming them. NYSDOH responded that the IE will receive information needed to identify members attributed to each PPS, and members not attributed to any PPS. The IE has further specified that they will create exact matches using available data on social security number, date of birth, and name across non–Medicaid datasets identified in this evaluation plan and will incorporate the whole population in their analysis.
Other methods for matching will be utilized (e.g., propensity score matching) as needed based on availability and reliability of the measures. Their analysis will be carried out at different levels of the population (aggregated view of impact at the state level, then at the PPS and intra–PPS level, and finally at a more individual level). Any issues with sample selection and missing data will be resolved using statistical methods (e.g., Heckman correction, MICE imputations). After data cleaning, the research hypothesis may be tested by changing the control and treatment groups; the IE has further specified that they will explore other options for exact matching or propensity score matching, and performing sensitivity analysis.
NYSDOH also responded to CMS´s suggestion that the evaluation include a plan for assessing the use of DSRIP funds for non–Medicaid populations (e.g., the uninsured to be included in the PPS implementing the "11th project.") CMS stated that if these funds represent a significant share of DSRIP funding, the design should include a sampling strategy documenting how this population is served and samples sufficient to estimate the impacts/benefits. Initially, NYSDOH stated that assessing the use of DSRIP funds for non–Medicaid populations such as the uninsured is outside of the scope of the evaluation (IE contract) and that a (contract) amendment would not be feasible with the timely submission of the Draft Interim Evaluation Report and Preliminary Summative Evaluation Report.
This has been revisited by the IE. SPARCS data would be able to be utilized to determine, in a limited capacity, utilization patterns of the uninsured in the inpatient and emergency department settings based upon the patient discharge dataset since those beneficiaries will not appear in the Medicaid claims. To examine whether the uninsured for the 14 PPS that are participating in the 11th Project are representative of the larger DSRIP population, the IE will examine hospital discharge records of the uninsured and compare the 14 PPS to the remainder.
|top of Section A.| |top of page|Section B:
Time Series Design:
As stated in Attachment 1 regarding the STC, quantitative analysis to assess the effect of DSRIP on a statewide level will use a time series approach to the comparison of health outcomes following the implementation of DSRIP, to a time period prior to DSRIP´s implementation.
B.1 Using this approach, the IE will test the following hypotheses:
- Health care service delivery will show greater integration.
- Health care coordination will improve.
- Primary care utilization will show a greater upward trend.
- Expenditures for primary care services will increase.
- Utilization of, and expenditures for, behavioral health care service will increase.
- Expenditures for emergency department and inpatient services will decrease.
- Primary care, behavioral health, and dental service utilization will increase among the uninsured, non–utilizing, and low–utilizing populations, while emergency department use will decrease.
- Through clinical improvements implemented under DSRIP, health care quality in each of the following areas will increase:
- Behavioral health
- Cardiovascular health
- Diabetes care
- Asthma
- HIV/AIDS
- Perinatal care
- Palliative care
- Renal care
- Population health measures will show improvements in the following four areas:
- Mental health and substance abuse
- Prevention of chronic diseases
- Prevention of HIV and STDs
- Health of women, infants, and children
- Avoidable hospital use will be reduced.
- Costs associated with hospital inpatient and ED services will show reductions or slowed growth.
- Total cost of care will show reductions or slowed growth.
The IE will emphasize comparison of health care service delivery, health improvements, and cost to the Medicaid program at the state level over the study period. They will also do an inter–PPS analysis to identify components that posed success or challenges for implementation and outcomes by difference–in–differences (DID) analysis. Possible improvement in 12 broad categories of health care under four (4) domains is envisioned.
The IE will use the interrupted time series design with segmented regression on the following statewide times series to evaluate the statewide impact of DSRIP with quarterly observations ending in April 2019. Using the dataset starting from 2005 and defining 2014 as DSRIP Year 0, the IE will have 10 years of pre–DSRIP data to control for existing trends in performance measures due to concurrent health care reforms, both nationally and statewide. The IE will examine if post DSRIP values are better than those of the pre–DSRIP period from the standpoint of utilization, spending, and change in outcome measures when compared to the newly designed Medicaid program.
Even though the IE will use the interrupted time series (ITS) design as the main component of their analysis, the ITS assumes that, without the intervention, trends in the outcome are not affected. The ITS design does not require the use of a comparison group, but is limited in controlling for external shocks (i.e., Medicaid expansion, individual mandate, overall changes in medical practice). This motivates the IE to explore if an appropriate non–DSRIP control group of patients (using propensity score or exact matching) or a comparison group of non–DSRIP providers (using cluster analysis to find similar hospital sites) can be identified for conducting DID analysis using time series and panel data. The IE realizes that a non–Medicaid population as a control group will be hard to identify because it would likely differ in many ways from the Medicaid population in terms of socio–demographic, and more importantly, by health. It will experiment with creating these comparison groups from the non–Medicaid population by matching all payer SPARCS data with DSRIP network information for at least a subset of its research questions. In addition, the IE will use a full–scope, Medicaid–enrolled, non–DSRIP attributed population as a control if the data are available. For research questions pertaining to performance in specific projects, PPS not selecting the project can also be used as a control group. The DID estimator only requires that in the absence of the treatment, the average outcomes of the treated and control groups would have followed parallel paths over time and that responses to "common shocks" (i.e., Medicaid expansion, individual mandate, overall changes in medical practice) are similar. Even this assumption may not be reasonable because the pre– treatment characteristics may be associated with the dynamics of the outcome variable that can affect the control and treatment groups asymmetrically. In this situation, the IE will experiment with Abadie´s (2005) simple two–step semi–parametric strategy to estimate the average treatment effect of the treated. These methods will have to be corrected for serial correlation in the outcome variable by using appropriate cluster analysis. The IE plans to experiment with the aforementioned ideas during the current year and use statistical tests to decide whether a comparison group can be identified for each of its research questions. For those questions where a suitable comparison group could not be identified, the IE will use the ITS to study the effect of DSRIP. These results will be reported in the "2019 Statewide Annual Report" and the "CMS 2019 Interim Evaluation Report."
B.2 Research Questions
| Research Question | Hypotheses |
|---|---|
|
|
|
Through clinical improvements implemented under DSRIP, health care quality in each of the following areas will increase:
|
|
|
|
Utilization of, and expenditures for, behavioral health care service will increase. |
|
|
|
Health care expenditures associated with services under DSRIP will show a reduction or slowed growth |
|
This RQ is not applicable to the Time Series Analysis. See Section C. |
The IE will consider two possible "comparisons." One is a patient–level control group made up of Medicaid beneficiaries who were not exposed to any PPS intervention for a certain amount of time, so they are direct controls for the intervention group of patients. The IE can match using propensity scores from Medicaid enrollment and claims, plus geography if possible. There is another "comparison" that is at the hospital level; which is hospitals that did not participate in the DSRIP, but have similar characteristics. This may be a challenge or actually be impossible to identify, because most safety net hospitals in New York are in a PPS. In that case, the IE would use the average rates of hospitalizations, Medicaid spending, ER visits, etc. and compare those hospital–level outcomes from the comparison hospitals to the PPS hospitals. In both cases, the IE could use DID, Time Series, or ITS. There are limitations for each. In DID, the IE is relying on two assumptions: 1) parallel trends, and 2) common shocks external to the intervention. In ITS, the IE is assuming that pre–intervention trends continue. The IE does not know which is true at this point because the IE does not have the data, so they will assess the utility of both methodologies. The IE can do DID with propensity score matching with patient level data, because there are enough non–PPS patients to find matches. DID with hospital comparison is tougher, because there will not be a good match one–to–one with PPS hospitals. Finally, DID analysis with another state is not feasible. It would not be within the scope of the IE contract for the IE to perform DID with comparisons from a non–DSRIP state.
As described in Section B.1, during the current year, the IE will explore creating a control group of non–DSRIP patients and a comparison group of non–DSRIP hospitals and assess whether it is feasible to use them given that DSRIP is so far reaching. Most Medicaid beneficiaries are receiving care and being exposed to PPS even if not technically attributed under the 50% threshold.
The Time Series Analysis will use a "global" comparison group to develop a state–wide control group of hospitals.
Additional information regarding the above Rqs:
Sub research questions were added or expanded for those noted below but others are not possible within the current scope of the contract.
RQ3. Also, racial and ethnic disparities will be addressed with respect to the following metrics: premature deaths, newly diagnosed cases of HIV, preterm births, adolescent pregnancy rate per 1,000 females aged 15–17, percentage of unintended pregnancy among live births, and infants exclusively breastfed while in the hospital. Disparities on these outcomes will be measured as ratios and will be treated as additional outcomes at the statewide level with the prediction that these ratios will show improvement (i.e., will be reduced) following DSRIP implementation.
RQ6. It is hypothesized that following the introduction of DSRIP, the health care of the Medicaid patients has become better and also the program has become economically more efficient. Due to small sample size and multiple hypotheses testing, correct significance levels have to be determined by controlling the false discovery rate (FDR), rather by conventional Bonferroni bounds.
Supplemental RQ: Was DSRIP cost effective in terms of New York State and federal governments receiving adequate value for their investments?
A set of measures described in the "DSRIP Strategies Menu and Metrics" will be used to quantify the performance measures. Because a large number of hypotheses will be tested, the problem of the inflated type I error will be mitigated by replacing the conventional Bonferroni methods with the control of the false discovery rate (FDR), defined as the expected proportion of errors (i.e., null hypotheses that are actually true) among a set of null hypotheses that have been rejected. In addition, a comparative analysis will be conducted for efficiency and effectiveness based on the chosen projects on alternative domains using a DID methodology.
B.3 Determination of Cost Effectiveness:
Cost–effectiveness analysis, in the simplest terms, calculates the ratio of the amount of "effect" a program achieves for a given amount of cost or investment in the program incurred, or conversely, the amount of cost required to achieve a given impact. For program evaluation such as the DSRIP evaluation, this means measuring the impact of a program on achieving a given policy goal (e.g., the additional reduction in avoidable hospital use as a result of DSRIP against the cost of the program). This ratio, when calculated for a range of alternative programs addressing the same policy goal, conveys relative impacts and costs of these programs in an easily understandable and intuitive way.
The value of cost–effectiveness analysis is two–fold: first, its ability to summarize a complex program in terms of an illustrative ratio of effects to costs, and second, the ability to use this common measure to compare multiple programs evaluated in different contexts and in different years. The first requires technical correctness with respect to the program´s actual costs of administration of the program and impacts as they were evaluated, while the second requires adherence to a common methodology for estimating costs and effectiveness across various programs. For cost–effectiveness analysis to be a useful tool, it is necessary to agree on an outcome measure that would be the key objective of many different programs and policymakers. In this evaluation, there are two obvious contenders: the reduction in avoidable hospital readmissions - a goal of the DSRIP intervention, and the improvement in health outcomes for the population-a public health goal. Since this is a summative evaluation method, the entire pre–post DSRIP time horizon will be taken for the analysis. The DSRIP policy is compared to a baseline policy of do–nothing, or status quo-traditional Medicaid for New York State. The incremental costs of each life–year gained or of hospital readmissions of the traditional and DSRIP Medicaid programs will be calculated, and the incremental cost per life year gained for each scenario will then be elicited. Sensitivity analysis will be conducted to assess the robustness of the results due to other policy changes in the system or a change in case–mix of the beneficiaries. The uncertainty surrounding the effectiveness of the program to reduce hospital admissions and readmissions and to improve life years gained, and their impact on total costs per life year gained or reduction in hospital readmissions, will be calculated using the minimum and maximum effectiveness values from the literature review currently in process by the IE concerning these outcomes.
The Time–Series component of the evaluation will focus on the macro–level cost–effectiveness analysis with the counterfactual being addressed in the pre–post DSRIP comparison. The comparative component will focus on the variations among PPS in the achievement of the effects noted above among the various programs and projects initiated across the State under the DSRIP program. Working closely with the NYSDOH in order to determine yearly costs of administering the Medicaid program in New York State prior to, and after the DSRIP incentive program, these costs will be compared to the yearly measures pre– and post–DSRIP in avoidable hospital readmissions and health outcomes such as life years gained. Cost effectiveness thresholds will be determined with the NYSDOH prior to the cost effectiveness evaluation and sensitivity analysis will be performed given that there are many health policy changes that affect the Medicaid population during this period of the DSRIP intervention as well as some provider changes within DSRIP. The complexity of this analysis will depend on the type and richness of the data acquired from the Assessor and NYSDOH. This macro–level analysis builds on findings at the state level of RQs 3 through 5. Since this is a pre–post comparison of costs and effects at the macro or PPS–level of analysis, the measures will be discounted for time value and adjusted for uncertainty and risk–attitude as noted above. Further, marginal cost–effectiveness will be calculated since the programs reflect an on–going decision–making process.
Challenges for the Cost–effectiveness Analysis
There are obstacles to obtaining the cost–effectiveness determinations, which include difficulties in obtaining costs of the DSRIP intervention by PPS or over time as the PPS learn about the best methods to deliver their project workflows to the targeted population. In order to mitigate this issue, sensitivity analysis will be performed in order to determine the robustness of the outcomes over time and for various policies that simultaneously affect the Medicaid population over the period considered.
|top of Section B.| |top of page|Section C:
Qualitative Analysis:
Qualitative information obtained from DSRIP planners, administrators, providers, and beneficiaries is expected to play a vital role in the DSRIP evaluation. The IE´s qualitative methods will:
- Identify facilitators and barriers to PPS achieving progress on pay–for–reporting/pay–for– performance metrics using feedback from PPS administrators, providers, and patients, as well as to identify these issues that are characteristic of particular strategies or projects.
- Conduct PPS case study evaluation by obtaining information from DSRIP stakeholders on an ongoing basis on program planning, implementation, operation, and effectiveness to guide quality improvement through project refinements and enhancements.
Qualitative methods to be used include key informant interviews, focus groups, and surveys, with issues to be investigated qualitatively to include notable program outcomes and challenges, effectiveness of governance structure and provider linkages, contractual and financial arrangements, challenges in the delivery of patient care, the effect of other ongoing health care initiatives (e.g., New York Prevention Agenda, Affordable Care Act) on DSRIP implementation and operation, and patient experience and satisfaction with services. In the qualitative component of the evaluation, the IE will develop qualitative instruments to address the central evaluation questions and to augment results of quantitative analysis. This will include the determination of interview or survey questions with appropriate review and pre–testing to ensure that questions are comprehensive, understandable, and reliable, a plan and schedule for data collection, and a plan for analysis.
The IE´s qualitative data collection will be designed to address the RQs, objectives, and aims presented in several of the main research questions, the broad objectives and issues to be addressed in this section. Qualitative data will provide context for the quantitative questions assessing RQ 1–4, which focus on system transformation, clinical improvement, and population wide projects (Domains 2–4). These questions focus on the implementation of projects initiated with the DSRIP program. Qualitative data will also address RQ 7, which asks about successes and challenges related to different aspects of the DSRIP program.
Gaining an understanding of these RQs, aims, and objectives will provide integral information on the implementation and operation of DSRIP, the successes and challenges of PPS and projects within DSRIP, and guidance on sustaining programming going forward.
The IE will use four major data sources to collect qualitative information from a number of relevant stakeholders in order to reach a diverse perspective and maximize the information collected. Interviews with PPS administrators, surveys with patients, and surveys with project– associated providers will be completed once over the course of data collection for each PPS. While it would be helpful to survey non–engaged providers for comparative purposes, this additional survey component is largely not feasible because the PPS will not have accurate contact information for partners from which they are no longer engaged. This component is also outside of the scope of the research questions. These data sources will be used to collect qualitative data on three major focal points: the DSRIP program overall, individual projects, and patient experience. In general, interviews and focus groups will be the major data source of patient satisfaction and experience, and surveys of providers will be the major source of project specific data. These methods of data collection were selected to be able to efficiently and thoroughly address all of the areas of inquiry described in the table below.
| Areas of Inquiry | Interviews with PPS Administrators and Staff | Focus Groups with Providers on Projects | Surveys with Patients | Surveys with Providers on Projects |
|---|---|---|---|---|
| DSRIP Program Overall | ||||
| Program planning, operation, and effectiveness | X | X | X | |
| Program outcomes and challenges | X | X | X | |
| Plans for program sustainability | X | X | ||
| Effectiveness of governance structure and provider linkages | X | X | ||
| Facilitators and barriers to PPS achieving progress on pay–for– reporting/pay–for–performance metrics | X | X | X | |
| Contractual and financial arrangements including provider transformation to Value Based Payments | X | X | X | |
| Challenges in the delivery of patient care | X | X | X | |
| The effect of other ongoing health care initiatives (e.g., New York Prevention Agenda, Affordable Care Act) on DSRIP implementation and operation | X | X | X | |
| Project Specific | ||||
| Progress/effectiveness of projects focused on system transformation | X | X | X | |
| Progress/effectiveness of projects focused on behavioral health | X | X | X | |
| Progress/effectiveness of projects focused on clinical improvement and population | X | X | ||
| Identify the issues that are characteristic of particular strategies or projects (in terms of metrics) | X | X | ||
| Patient Experience | ||||
| Patient satisfaction and experience | X | |||
Prior to collecting data through surveys, focus groups, and interviews, there are a number of preparatory actions that will occur, including identifying participants, preparing protocols, and working with state and local Institutional Review Boards to ensure compliance with human subjects´ requirements.
The IE will work closely with the PPS staff and administrators to identify the appropriate stakeholders needed for interviews and focus groups. PPS will aid the IE by providing lists of names and contact information for appropriate PPS planners and administrators for interviews. In addition, lists of names and contact information (including email addresses) will be sought from PPS identifying relevant providers that are associated with and knowledgeable of each of their DSRIP projects. This information is necessary for the administration of surveys addressing specific projects. Because provider lists are so vast within the PPS, identifying the appropriate stakeholders is important as it will guide recruitment efforts for focus groups, with the goal of recruiting a diverse group of perspectives.
Another preparatory activity is developing question sets and protocols. Because the goal is to hear diverse perspectives on research objectives, numerous questions will be asked from multiple stakeholders to gain a holistic understanding of all areas of inquiry. Question sets will be developed for each method of data collection. Interviews and focus group question sets will be semi–structured, such that all respondents (PPS administrators or providers) will be asked the same questions; however, some items may elicit probing for additional information. Survey items will be selected using existing measures whenever possible to ensure psychometrically rigorous measures are employed. Questions will be developed for any question areas without existing measures. All items will be carefully reviewed and pre–tested, which will ensure that all items are easily understandable and thorough. All data collection protocols will be approved by the Institutional Review Board (IRB) at the SUNY at Albany, for human subjects´ research. Changes to interview and focus group questions may be necessary based on responses during early data collection. Any changes will be carefully reviewed by the IE and approved by the IRB, as needed before use. In additional, all IE staff involved in data collection will be trained on the handling and storage of confidential information.
Once approaches are developed and participants are identified, focus groups, interviews, and surveys will be scheduled and conducted.
| Population | Method | Cycle 1 April 2017 – Dec. 2017 |
Cycle 2 April 2018 – Dec. 2018 |
Cycle 3 April 2019 – Dec. 2020 |
|---|---|---|---|---|
| PPS Administrators | Telephone Interviews |
25 | 25 | |
| PPS Team Leaders | Telephone Interviews |
125 | ||
| DSRIP–Associated Providers | Focus Groups |
8 Groups | 8 Groups | 8 Groups |
| DSRIP–Associated Providers | Web Survey | 2400 w/response rate goal 50–60% | 2400 w/response rate goal 50–60% % | 2400 w/response rate goal 50–60% |
| Patients | Phone/Mail Survey |
CAHPS Survey Data from DY1–5 | ||
C.1. PPS Administrative Key Informant Interviews
Sample Selection
Key informant interviews will be conducted with administrators and staff annually in each of the 25 PPS located throughout the four regions of New York State. In the first year of data collection, interviews will be conducted with PPS administrators. Using purposive sampling (Bryman 2012; Creswell 2013; Patton, 2002), PPS administrators chosen for interviews will be individuals who are most knowledgeable about DSRIP start–up, implementation, ongoing processes, administrative components, and challenges. Specifically, the sample will include the chief executive officer, chief operating officer, or the individual currently responsible for all operations; someone with authority who was involved in PPS startup; the fiscal officer or individual involved in financial transactions; and others identified by either the NYSDOH or the PPS who are vital to the ongoing operations of the PPS. Each PPS had leadership join at different junctures, and many will have leaders with specialized knowledge in certain areas. In the second year of data collection (DSRIP DY4), the research team will schedule interviews with PPS leaders responsible for the implementation and operation of their selected projects. Each PPS has selected up to 11 DSRIP projects from the DSRIP Project Toolkit (e.g., the integration of primary care and behavioral health services, development of community–based health navigation services). These interviews will shed light on factors related to the successful implementation of various DSRIP projects. The sample will include all PPS staff members with professional experience launching or running PPS projects. In the third year of data collection, the research team will again schedule interviews with PPS senior leadership for follow up.
Data Collection Procedures
Telephone interviews will be scheduled at the convenience of the PPS staff and administration and will be conducted with PPS staff and administrators annually in these periods:
- Research Cycle 1 (July – December 2017): Senior Leadership
- Research Cycle 2 (July – December 2018): PPS Staff Responsible for Projects
- Research Cycle 3 (July – December 2019): Senior Leadership
The interviews will be guided by a semi–structured interview protocol and should take no more than two hours to complete. A core set of questions will be asked of all key informants, and a subset of questions and probes will be developed based on each key informant´s roles, knowledge, and responsibilities.
Interviewers will be trained by experienced staff at the Center for Human Services Research who have many years of experience in qualitative interviewing. Trained interviewers will study and review the semi–structured interview protocol at length prior to interviewing to ensure that adequate interview structure is maintained and interviewing is conducted seamlessly. Interviews will be recorded electronically to preserve the content and ensure that each interviewee perspective is accurately captured. Interviews will be transcribed manually during the course of the interview by a research assistant with the Center who will later review the recording and transcribe any missing content.
In the first year of data collection (DSRIP DY3) with the senior leadership team of the PPS, the interview questionnaire will be designed to address the following topics:
- Initial formation of the PPS – exploring the development of the relationships required to form the PPS as well as the project selection.
- Challenges during years 0–2 of DSRIP implementation – exploring launching of the projects, workflow, and engagement with community partners. The IE will also ask about resources required to operate projects.
- Successes during years 0–2 of DSRIP implementation – exploring the application process, project workflow, community partner engagement, and projects.
- Committees – exploring effectiveness of the PPS´ governance related–committees and modifications to the committees over time. Also explores challenges and successes related to committees.
- Data – exploring what specific data (quality, financial, utilization, and/or population health measures) the PPS thinks is most important to evaluating progress and success.
- Account Support – exploring the account support provided by NYS for the PPS and the projects.
- Value based payment – preparatory activities and sustainability plans for the future
- Viewpoint – exploring changes to the healthcare system from DSRIP and other interventions in NY.
- Other issues – comments on areas the IE may have missed.
In the second year of research collection (DSRIP DY4), the research team will schedule telephone interviews with PPS staff responsible for projects. The topics to be discussed in the interview are:
- Initial planning of the projects – exploring effectiveness of project selection and planning.
- Major outcomes and challenges of the projects – exploring project launch, major milestones achieved and missed, barriers to project implementation, and methods barriers were overcome (or plans for overcoming).
- Program sustainability – exploring plans for project sustainability (i.e., continuing projects post–DSRIP).
- Structure and provider linkages on projects – exploring the effectiveness of the project governance structure and provider participation in reaching project milestones.
- Facilitators and barriers to PPS achievement of progress on pay–for–performance metrics related to project milestones – exploring the ways in which PPS are working toward pay– for–performance and the facilitators and barriers for particular projects that are excelling or falling behind on milestones.
- Contractual and financial arrangements – exploring how PPS financial contracts and planning contribute to project milestones and success or failure.
- Changes in the delivery of patient care – exploring the way DSRIP projects have affected the way patients are treated in terms of quality and delivery of care.
- Other ongoing health care initiatives – exploring whether other ongoing initiatives (e.g., NY Prevention Agenda, ACA, Value Based Payments) have had an effect on specific project implementation and operation.
- Progress/effectiveness of projects focused on system and VBP transformation.
- Progress/effectiveness of projects focused on behavioral health.
- Other issues – comments on items we may have missed.
In the third year of data collection, DSRIP DY5, the research team will again schedule interviews with PPS senior leadership. Anticipated topics for the final key informant interviews are:
- Challenges during years 3–5 of DSRIP implementation – explores launching the projects and other workflows including engagement with community partners. We will also ask about resources required to operate projects.
- Successes during years 3–5 of DSRIP implementation – explores project implementation and workflows, and provider and community partner engagement.
- Pay–for–performance – a lookback at the shifts related to pay for performance from DY3 forward.
- Committees – explores effectiveness of the PPS´s governance related–committees and modifications to the committees over time. Also explores challenges and successes related to committees.
- Data – explores what specific data (quality, financial, utilization, and/or population health measures) the PPS thinks is most important to evaluating progress and success.
- Account Support – explores the account support provided by NYS for the PPS and the projects.
- Value based payment – successes and challenges to date.
- Viewpoint – changes to the healthcare system from DSRIP and other interventions in NY and future PPS Sustainability plans.
- Other issues – comments on items we may have missed.
Challenges
There are a number of challenges to key informant research of this scale. First, engaging the study population to participate in interviews may be difficult. The research team is requesting time from busy professionals. The research team will mitigate this challenge in several ways. The IE will craft a well–structured communications plan that carefully lays out what is expected of the PPS professionals at each juncture in terms of content, time, and its impact on their performance. Having this communications plan in place will streamline the interviewing process, instill participant confidence in the researchers´ methods, and increase the likelihood of participation. In addition, researchers will also communicate the extrinsic rewards of participating in the research to interviewees (e.g., input from interviews will be communicated to policy makers who have the power to foster meaningful changes at the system level). The communication plan, combined with a thorough explanation of the extrinsic rewards, will combat the difficulties of participant engagement.
Another challenge is that because the evaluation begins in the middle of the demonstration, there may be difficulties in recall of initial startup and implementation phases of DSRIP. The research team will resolve these challenges by using the first research cycle (operational in DSRIP DY3) to ask retrospective questions on the DSRIP initiative to date to glean a broad characterization of DSRIP process and progress. The questionnaire was designed with this lookback procedure in mind and consequently tailored to contain probing questions to enhance participant recall. We will also recruit individuals who have historical knowledge of the program to the key informant interviews so that recollection is augmented. Retrospective data collection is not ideal, but it is commonly used to capture perceptions of change from participants. In addition, qualitative data for the remaining 2.5 years of the demonstration project will be collected in real time, which will provide context and information regarding both the present operation and planned sustainability of projects.
C.2 Focus Groups with Project–Associated Providers:
Focus groups will be conducted with select project–associated providers. The sample will be selected based on geographic location and provider type. Focus groups function best when groups are somewhat homogenous, which fosters greater cooperation, greater willingness to communicate, and less conflict among group members (Stewart & Shamdasani, 2015). The creation of groups based on provider types ensures that each focus group is comprised of individuals whose work is similar, allowing for more candor and in–depth participation from individuals. Drawing from research on best practices for conducting focus groups, the number of participants for each focus group will be limited to 10–12 individuals; this group size allows participants sufficient time to share insights, yet is large enough to provide a diversity of perspectives. The focus groups will be guided by a focus group category, with questions tailored to each PPS group. Each focus group will last approximately one to 1.5 hours. Focus group participants will be informed of the research protocol regarding confidentiality before the session begins. This includes reporting the findings as a group and not associating anyone with individual remarks. With the permission of the participants, all qualitative focus groups and interviews will be audio–recorded and transcribed verbatim, and field notes will be taken to document the process.
Planned topics for the focus groups include:
- Engagement of providers with DSRIP activities and projects
- DSRIP transformation of professional responsibilities
- Integration of projects with other projects or services received by patients
- Characterization of DSRIP to–date
- The effect of other ongoing healthcare initiatives on DSRIP, such as NY Prevention Agenda and the ACA
- Progress of the DSRIP projects and impact on provider´s area of work
- Factors that influence achieving pay–for–performance
- Barriers that influence achieving pay–for–performance
- Transformative efforts toward Value based payment
- Characterization of the contractual and financial arrangements
- Other changes the project partners would recommend
Challenges
A critical challenge for conducting these focus groups includes establishing a sampling frame that captures the allocation of provider types across PPS groups and counties. The research team developed the hybrid focus of balancing provider types by geographic areas after significant consultation with key leaders at NYSDOH and the DSRIP PPS Account Support team. The hybrid focus will allow researchers to combat these challenge to the utmost extent possible.
A challenge that is inherent to conducting standard focus groups includes difficulty recruiting busy professionals from their demanding clinical responsibilities. Using a communication strategy that includes support from the PPS entities and DOH, the research team will convey information on the benefits of participation to all providers and provide flexible scheduling times, such as early morning or evening times if necessary. Focus groups also face challenges in terms of gathering retrospective data. As the IE is conducting focus groups across three–time points, the IE will only ask lookback questions to the groups held in research collection year 1. To address this challenge, the IE will supplement the data collected via this method by also collecting lookback data from the DSRIP–associated provider survey respondents. The IE will be able to ask more detailed questions about progress, successes, and challenges to date via survey techniques.
C.3 Survey for Patients:
In 2015, in response to the NYSDOH Request for Proposals (RFP), the IE proposed to collect patient surveys. The original evaluation plan described that each PPS would collaborate with researchers to identify patients who were eligible to participate. Planned criteria included patients age 18 and older who had not opted out of DSRIP–related data collection. Research cycle 1 was slated to begin in March 2017 (DSRIP Demonstration Year (DY) 2) and end December 2017 (DSRIP DY3). The survey was planned to repeat for three research cycles, ending in 2019. Planned survey topics included patient satisfaction, reactions to changes to care, and patient experience overall.
NYSDOH is currently fielding a CAHPS survey that will be provided to the IE, rather than requiring the creation and administration of a separate DSRIP–specific survey.
In order to obtain adequate response rates for this difficult–to–reach population, researchers planned on using a hybrid mail and web–based approach. The target sample size for the survey was anticipated to be 1,500 patients surveyed with a response sample of 450 per research cycle.
After a comprehensive review of challenges to an IE–sponsored patient survey and the current data collection burdens on Medicaid members, the IE received approval to perform secondary analysis on the NYSDOH–sponsored Consumer Assessment of Healthcare Providers and Systems (CAHPS©) Health Plan survey for Medicaid enrollees that has been run since DSRIP DY1. After DSRIP was launched the NYSDOH tailored the report to assist NYSDOH and participating PPS in pinpointing opportunities to improve Medicaid members´ experiences. The survey, the CAHPS© C&G Adult Medicaid core survey (Primary Care, version 3.0), is a nationally vetted tool designed to measure patient experiences. The survey was customized to include 18 supplemental questions concerning health literacy, health promotion, and care coordination. The NYSDOH has run the CAHPS © survey each year since year 1 of DSRIP. The survey is sent to 1,500 patients from each of the 25 PPS for a total sample size of 37,500.
The IE´s original evaluation questions for patients were focused on how the patients were experiencing change and their satisfaction with that change. As we now know, since patients do not know that they are in a PPS or part of DSRIP, the scope of the RQs questions has changed. The IE is now interested in reviewing trends and changes to access to care and experiences with care. They are aware that there is no information from before participation in DSRIP or from a control group. As this is an implementation sub–study of the larger IE study, the IE can integrate their findings with the rest of their data without a control group. They will measure change through displays of descriptive statistics from both individual questions and composite measures. They will display the trends from each PPS and statewide.
For questions related to access to primary care, the IE will use:
- Q2. Provider is usual source of care
- Q3. Length of provider relationship is at least 1 year or longer
For questions related to experiences with care, the IE will use:
- Q25. Rating of Provider
- Composite: Getting Timely Appointment, Care, and Information
- Composite: How Well Doctors Communicate with Patients
- Composite: Care Coordination
- Composite: Helpful, Courteous, and Respectful Office Status
Challenges
The IE had always planned to use descriptive statistics for any patient survey data. While they cannot view or analyze data to the individual level from the CAHPS © reports, they can look at the breakdown of composite measures across the state and within each individual PPS. The IE will also provide response rates for each PPS. These data points are appropriate for their planned reports including both the annual statewide and PPS reports as well as the interim and final Independent Evaluator reports slated for 2019 and 2021, respectively.
In addition to the data from these comprehensive, representative surveys, the IE may also explore patient focus groups. The IE would hold six to eight patient focus groups centered around changes from DSRIP project 3.a.i. Integration of primary care and behavioral health services.
Recruitment of these patients is dependent on the PPS staff linking the IE with medical facilities and providers that would be open to hosting focus groups. Development of these groups is also dependent on the rollout of project 3.a.i. and that project´s patient engagement. The IE will work closely with the NYSDOH in DSRIP DY4 to determine feasibility of this approach and the types of data that would be appropriate to collect from the consumer facing group. The IE may also request to review findings from ongoing STC–required Consumer Education Campaign focus groups that the NYSDOH is running in complementary efforts.
Survey for Project Providers
C.4 Electronic Survey of Project–Associated Providers Sample Selection
In order to gather uniform information on the functioning of individual projects, an electronic survey will be administered annually to project–associated providers. The sample will be drawn from lists maintained by PPS administrators of providers who are associated with each of their projects and known as "engaged providers." The IE anticipates the survey will target 2,400 providers annually, a number that is based upon response rates in past research with health care professionals that have generally yielded response rates between 50 and 60% (McLeod et al. 2013; Nielsen et al., 2009; Podichetty et al., 2006). A sample of 1,200 health care providers will allow researchers to examine the data by various subgroups (e.g., provider type) and allow for analyses based on geographic location. Researchers at the Center for Human Services Research are immersed in the literature on best practices in survey collection, have extensive experience in this area, and have specifically investigated approaches for maximizing participation in electronic surveys among health care professionals to ensure an adequate sample is achieved (e.g., McLeod et al. 2013).
Data Collection Procedures
Surveys will be conducted with DSRIP–associated providers once per year in the following periods:
- Research Cycle 1 (July – December 2017)
- Research Cycle 2 (July – December 2018)
- Research Cycle 3 (July – December 2019)
The electronic survey will utilize Qualtrics Survey Software to ensure accurate data capture and preserve participants´ responses in a confidential manner. Qualtrics Survey Software is known for its elegant design that will mitigate any difficulties that generally arise in web navigation with electronic surveys. In addition, the survey length will be as short as possible while collecting all relevant information so as to encourage participant responses and reduce respondent fatigue.
The link to the survey designed in Qualtrics will be emailed to individuals from the list of engaged providers. The sample of engaged providers will be developed from the DSRIP MAPP Provider Import Tool and its hybrids used by each PPS. Contact information may need to be validated from a second contact database but the Provider Import Tool or the similar tool being used by the PPS will be the determination of how providers are designated as "engaged." Providers will have ample time to respond and gentle reminder follow up emails will be sent to encourage providers who have not yet participated to complete the survey.
The survey questions will focus specifically on progress within individual projects, barriers and facilitators to project implementation, and perceived effectiveness. The survey will generate user–based responses that will allow the IE to provide individualized feedback to each PPS for quality improvement of their projects (Bate & Robert, 2007). Topics will include:
- Service provision within each project dimension
- Project operation compared to the planned model and reflection of this change over implementation years
- Future anticipated changes to project models
- Factors of each project that have helped or hindered with implementation
- Challenges faced in working with the PPS entities
- Challenges faced with specific projects and corrective actions (if any)
- Changes to project(s) or DSRIP operation
- Level of satisfaction with planning process
- Reflections on what worked well and less well during the planning process
- Value based payment readiness and change
- Changes to program planning processes for specific projects
- Satisfaction with current operation
- Overall perception of DSRIP
- Overall perception of projects
Project Providers Survey Challenges
One major challenge to survey data collection includes identification of the sample. The research team will work with NYSDOH and the DSRIP Account Support team to develop a method to pull the sample and ensure its accuracy. It is anticipated that the sample will be pulled by the research team manually from the MAPP Network tool. The challenge with sample identification in this case is that it will require collaboration with these entities as well as the PPS to identify potential providers who will participate; however, the research team at the Center for Human Services Research is poised to meet this challenge based on the team´s extensive experience in coordinating data collection endeavors of this nature through other quantitative research projects. This challenge will be mitigated both through the experience of the research team as well as the planning that went into utilizing the MAPP Network tool to pull the sample.
A second anticipated challenge is accurate categorization of provider type. Upon receipt of feedback from the PPS entities during the DSRIP Mid–Point Assessment, NYSDOH allowed PPS to broaden their own categorization tools in early 2017. This tool replaces the Provider Import Tool (PIT) and allows for greater customization. As not every PPS will broaden provider categorization. The survey must be designed to collect responses on categorization type and should mirror the language that the PPS entities use to define their providers. Another challenge is that providers may engage with multiple PPS entities on the same or different projects. The survey will be designed to allow for separate responses for project questions per PPS entity.
C. 5 Other Data Collection
To reflect the real–world nature of this evaluation and to gather data from all stakeholders, the IE will explore the addition of other surveys or interviews.
Managed Care Representatives – The IE will explore the addition of a survey with managed care representatives in DSRIP DY5. The sample would include representatives from the 18 mainstream plans. Topics to be covered in the survey include successes and challenges of DSRIP related initiatives to date, engagement with PPS and transformative efforts of DSRIP toward managed care plan value based payment contracting.
Project Approval and Oversight Panel (PAOP) – The IE will survey the members of the Project Approval and Oversight Panel in DSRIP DY4 to gather their perspectives on the implementation and process progress of DSRIP. They will also collect their feedback and suggestions.
C.6 Implementation/Process Analysis Summary
Analysis will focus on identifying usable feedback for improvement for each of the 25 PPS. An additional focus will be identifying common and unique themes that arise in the data to inform the evaluation of DSRIP implementation as a whole. Any quantitative survey data will be analyzed using SPSS statistical software. The qualitative data obtained through key informant interviews, focus groups, and open–ended survey questions will be transcribed and analyzed, using a qualitative data software program.
Coding and analysis of qualitative data will follow the strategies described by Bradley, Curry and Devers (2007). Once data are organized and reviewed, the IE will use an integrated approach to identify and categorize the data according to concepts, relationships between concepts, and evaluative participant perspectives. Categorization based on setting and participant characteristics will also be completed, as appropriate. This categorization process facilitates the development of taxonomies, themes and theory, and comparisons. Responses will then be reviewed independently by at least two IE staff utilizing the finalized coding structure. Any coding discrepancies between reviewers will be resolved with discussion to achieve consensus. Coded data will be analyzed and interpreted to identify major concept domains and themes. Analysis will focus on understanding of the DSRIP initiative as a whole, as well as on understanding of each individual PPS.
Progress on qualitative data collection and analysis will be included in quarterly progress reports, as well as any changes in implementation strategies that have occurred based on feedback to the PPS and project sites. In addition, results from the qualitative data analysis will be reported in the overall annual reports. Information on individual PPS will be presented in annual case study reports to each PPS to be used to guide quality improvement through project refinements and enhancements. Qualitative data will also contribute to the interim and final summative reports.
|top of Section C.| |top of page|Section D:
Comparative Analysis:
To address questions pertaining to the effects of type of projects adopted by the PPS, the relative effectiveness of specific strategies employed within project types, and the contextual factors associated with PPS success or failure to demonstrate improvement in the metrics associated with each domain, quantitative and qualitative comparatives may include the following:
- Where there is variation in the strategies selected per the PPS project requirements described in the STC above, assess the effect on the pertinent outcome of PPS having selected a particular strategy. For example, a comparison would be made in the improvement in diabetes care (Domain 2) between PPS that implement a project to address this issue and PPS that do not.
- The relative effectiveness of particular projects intended to produce the same outcome. For example, among PPS that opt for a strategy to improve asthma care, compare such improvement between those PPS that chose to implement a project to expand asthma home–based self–management programs to those PPS that chose alternative projects to improve asthma care.
- Identification common to those PPS receiving or not receiving maximum payment based on project valuation.
- Comparisons between PPS operating in different regions of New York to identify successes and challenges associated with local resources or procedures.
- Patient–level comparisons by factors such as age, sex, race, presence of selected chronic conditions, and mental health/substance abuse status to obtain information on variations in service experience and satisfaction under DSRIP, by patient characteristics.
The comparative analysis will be designed by the IE to address the seven (7) research questions (RQ)(see Section B.2). The IE´s approach is to apply quantitative techniques to assess relative PPS performance on domain–specific metrics over time, and supplement this work with qualitative data collection to provide further contextualization of the findings. Specifically, the IE will supplement their quantitative analyses of publicly available data sets by analyzing other primary data, such as 1) focus groups, 2) semi–structured key informant interviews with PPS administrators and staff, 3) surveys of providers with semi–structured interview follow–up, and 4) surveys with patients, to provide further contextualization of results. The approach will include clustering PPS to create comparison groups according to project selections, the uses of DID methodology, as well as multi–level modeling.
Further the IE will develop a compendium of domain projects across all DSRIP PPS that includes information important to the comparative analysis. The compendium will include information on timeline (start and end dates of implementation), planning decisions (changes that occurred prior to implementation or during implementation), fidelity of the intervention to its original intent (ranked low to high), relative success to internal expectations (low to high), and previous work (was the program new or building upon existing, pre–DSRIP activity). This compendium will allow the IE to examine variation between PPS within projects and across domains in a way that will contribute to the IE´s understanding of DSRIP and exploit less apparent differences between the programs and projects to drive analyses. For example, if two projects look the same "on paper" but one is new and one is based upon existing initiative, the IE might see differential outcomes (if the IE is looking at change over time).
The comparative analysis will be designed to address the seven RQs with specific emphasis on the five specific issues in this section above. The research aims for comparative analysis are:
- To compare PPS performance on domain–specific metrics for those that did/did not adopt specific DSRIP projects.
- To evaluate the relative effectiveness of specific strategies employed within specific projects.
- To examine contextual factors related to PPS successes and failures in demonstrating improvement in domain–specific metrics.
The conceptual framework below depicts the factors that are expected to impact health outcomes in the broader context of the DSRIP program. System Transformation (Domain 2), Clinical Improvement (Domain 3), and Population–wide Strategies (Domain 4) are all anticipated to impact patient–level outcomes. Moreover, broad external factors, such as economic conditions, immigration, and unemployment, are also likely to influence patient outcomes. To this point, issues related to beneficiary eligibility and the frequency of patients going in and out of the Medicaid system tend to play a role in influencing health outcomes. In addition, the varying performance levels and culture related to organizations that are early adopters versus late adopters of DSRIP projects and strategic initiatives also are likely to play a role in determining patient–level outcomes.
Conceptual Framework:
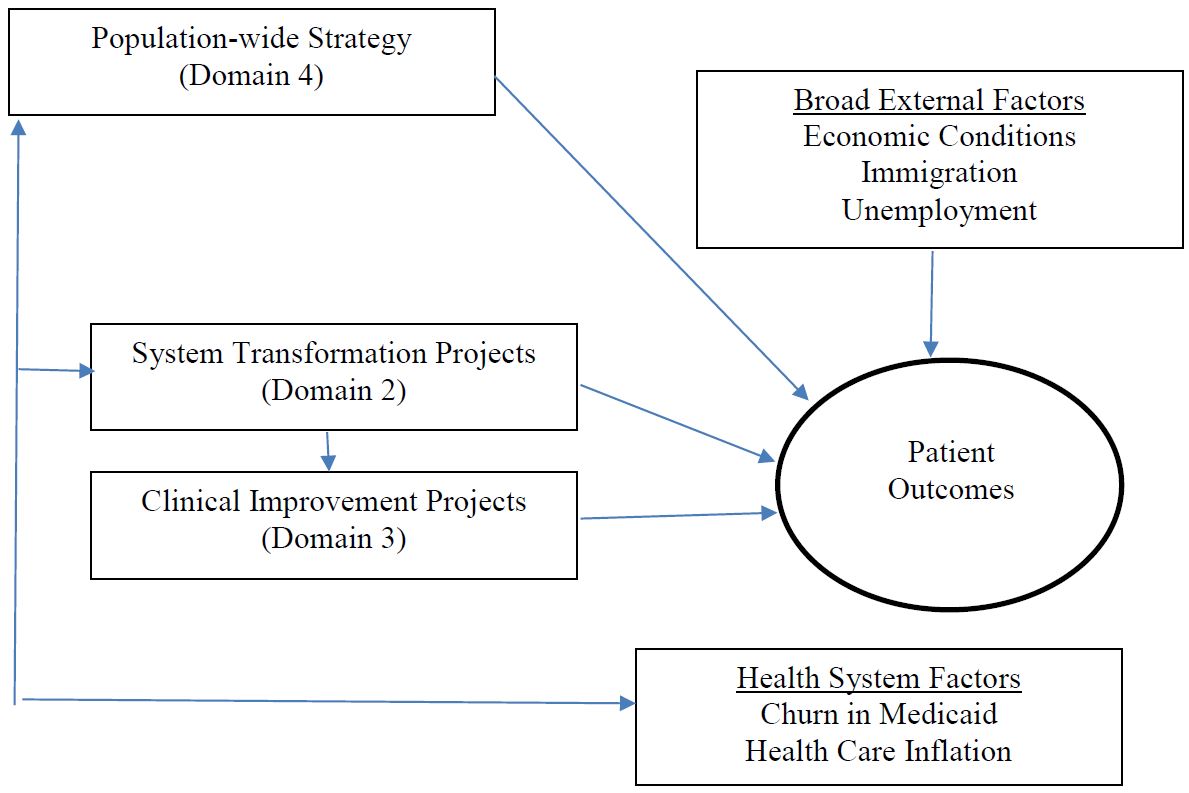
Evaluating DSRIP, given the multiple PPS networks, partnerships, and projects within each domain, is a complex endeavor. The IE will leverage both qualitative and quantitative data to inform the evaluation design by embracing the variation across and within PPS interventions and the varied goals of each.
Early analyses will focus on the direct relationship between domain projects and the ultimate outcome measure. Analyses will be descriptive in nature when examining broader PPS outcomes, but additional multivariate analysis will be used to control for differences between populations, regions, providers, and other characteristics of the PPS that exist beyond the intervention or within the intervention project.
Descriptive Analysis Example for Domain 2 Impact on Emergency Department Visits:
| PCMH/Advanced Primary Care (N=5) | → | Reduction in ED Use per 1,000 visits (%) |
| Integrated Delivery System (N=22) | → | Reduction in ED Use per 1,000 visits (%) |
In the example above, the underlying hypotheses are that specific Domain 2 projects will result in reductions in the percentage of emergency department (ED) visits per 1,000 total visits over time (from pre–DSRIP to post–DSRIP) in aggregate. Testing this hypothesis will simply use the inventory of DSRIP projects across PPS and use descriptive statistics to understand if the percent change in ED visit use was reduced in the five PPS that had a Patient Centered Medical Home (PCMH)/Advanced Primary Care intervention when compared to sites without a PCMH/Advanced Primary Care intervention, and separately calculate whether the 22 PPS with an integrated delivery system intervention experienced a reduction in ED visits when compared to those without an integrated delivery system intervention. These descriptive tables will give a general sense of what happened for the groups of sites that opted into a specific Domain project versus those that did not, but does not address multiple interventions in the same domain or control for underlying PPS characteristics. The unit of analysis will be the PPS site and data will be pulled from the PPS project list and administrative records (Medicaid claims for ED visits) and/or PPS Quarterly Implementation Project Plan Reports (from the PPS to NYSDOH). The resulting table is likely to appear in the evaluation report in the following format:
Example Output for Bivariate Analysis by Project:
| Domain 2 Project | Number of PPS participants | Measure 1: Percentage Change in ED Visits per 1,000 | |||||
|---|---|---|---|---|---|---|---|
| Baseline Rate | Year 1 | Year 2 | Year 3 | Year 4 | Year 5 | ||
| 1. Integrated Delivery System | 22 | 1.3 per 1,000 visits | −0.2 | −0.3 | −0.4 | −0.3 | −0.5 |
| 2. PCMH/Advanced Primary Care | 5 | 1.1 per 1,000 visits | −0.1 | −0.2 | −0.3 | −0.2 | −0.4 |
The second stage of descriptive analysis will focus on interactions between Domains and Projects between PPS networks, to better understand the impact of the customizability and flexible nature of the DSRIP interventions the IE is tasked with evaluating. The additive relationship of implementing a PCMH/Advanced Primary Care project along with an integrated delivery system project can be better understood and incorporated into the evaluation approach. The table below is likely to appear in the evaluation report in the following format:
Example Output for Bivariate Analysis by Project Combinations:
| Domain 2 Project | Number of PPS participants | Measure 1: Percentage Change in ED Visits per 1,000 | |||||
|---|---|---|---|---|---|---|---|
| Pre− DSRIP Rate | Year 1 | Year 2 | Year 3 | Year 4 | Year 5 | ||
| 1. Integrated Delivery System only | 19 | 1.2 per 1,000 visits | −0.2 | −0.3 | −0.4 | −0.3 | −0.5 |
| 2. PCMH/Advanced Primary Care only | 2 | 1.0 per 1,000 visits | −0.1 | −0.2 | −0.3 | −0.2 | −0.4 |
| 2 & 3. PCMH/Advanced Primary Care + Integrated Delivery System | 3 | 1.4 per 1,000 | −0.2 | −0.2 | −0.3 | −0.4 | −0.5 |
In both of the examples above, the unit of analysis is the PPS, with the projects aligned with aggregate measures of ED visits reported or calculated at the PPS level. However, the IE also plans to leverage the individual level data when possible to understand the independent effects of each project on patient–level outcomes by controlling for individual patient characteristics for the beneficiaries nested within each PPS, and developing multivariate models to predict ED use over time using the Medicaid claims data to understand ED use for each individual. The regression analysis could focus on the rate of change in ED use over time, but because ED use is a fairly rare outcome at an individual level (more than half of subjects may have no ED use at all in a given year [Kaiser Family Foundation]), it would make more sense to use a two–step model predicting ED use (binomial logistic regression) and a conditional model (log–link Poisson or GLM model) for those with any ED use predicting the number of ED visits over time for each individual. Each individual would be nested in a PPS based on where they are attributed according to administrative records, and the qualitative data or progress reporting would be used to assign PPS values to capture categories of projects and/or variation in the interventions within project. While there are not sufficient degrees of freedom to do regression analysis at the PPS level, the individual level data would provide substantial data to test hypotheses about population health outcomes and measure change as a result of the DSRIP overall and individual projects or combinations of projects. The resulting regression equations would be based upon the distribution of the data and variables from the multiple data sources available to the IE. The two– step model would be based upon the following general theory:
Step 1: Binomial Logistic Regression Predicting any ED Use
Y1pt Bo+ Bp1D2PROJ1t+ Bp1D2PROJ2t+ BiRACE1+ IS11AGEit + BiGENDER1 + B1ILLNESS1 + B1tAIDCODEit + B1tMONTHS1t + E
where:
y = Presence of any Emergency Department visit during year
D2PROJ1 = Domain 2, Project 1(Integrated Delivery System)
D2PROJ2 = Domain 2, Project 2 (PCMH/Advanced Primary Care)
ILLNESS = Presence of a chronic illness
AIDCODE = Medicaid aid code assigned by eligibility worker for a 12–month period
MONTHS =total number of months enrolled in Medicaid in a given year
i = individual
p = Performing Provider System Setting t = year
E = error term
Step 2: Log–Link Poisson Regression Predicting Number of ED Visits
N;pt = B0+ BμtD2PROJlt+ BptD2PROJ2t+ B;RACE;+ B;tAGE;t + B1GENDER; + B;ILLNESS; + B;tAIDCODE;t + B;tMONTHS1t + e
where:
N = Count of Emergency Department visits in year D2PROJ1 = Domain 2, Project 1 (Integrated Delivery System)
D2PROJ2 = Domain 2, Project 2 (PCMH/Advanced Primary Care) ILLNESS = Presence of a chronic illness
AIDCODE = Medicaid aid code assigned by eligibility worker for a 12–month period
MONTHS = total number of months enrolled in Medicaid in a given year
i = individual
p = Performing Provider System Setting
t = year
e = error term
D.1 Measures:
To ground the IE´s comparison of PPS, they have identified a number of measures that have broad–ranging implications on the overall success of the DSRIP program. These measures were chosen based on their potential relevance to the overall DSRIP goals (e.g., reducing avoidable hospital use by 25 percent over five years) and the four most notable disease areas based on DSRIP project selections and the overall burden of disease in New York State. The IE will use these metrics as the basis for their comparative analysis of PPS. Additional metrics can be added based upon priorities of the NYSDOH and project resources.
| Domain/Category | Measure Name | Measure* Steward | Data Source* | National Benchmark Available |
|---|---|---|---|---|
| Domain 2, A | Potentially avoidable ER visits | 3M | MACPAC Report (preferably with Medicaid) | |
| Domain 2, A | Potentially avoidable readmissions | 3M | No | |
| Domain 2, A | PQI suite –; composite of all measures | AHRQ | No | |
| Domain 2, A | PDI suite –; composite of all measures | AHRQ | No | |
| Domain 2, A | CAHPS measures (various) | AHRQ | Only with other state reports. There is no national CAHPS for Medicaid only. | |
| Domain 2, B | CAHPS measures (care coordination with provider…) | AHRQ | Only with other state reports. There is no national CAHPS for Medicaid only. | |
| Domain 3, A (BH) | All claims and MDS– based metrics (see DSRIP Strategies Menu and Metrics) | 3M, NCQA, CMS | Medical Record, MDS | No |
| Domain 3, B (CVD) | All claims metrics listed in DSRIP Strategies Menu and Metrics | AHRQ, NCQA, CAHPS | Claims, Survey, Medical Record | No |
| Domain 3, C (Diabetes) | All claims metrics listed in DSRIP Strategies Menu and Metrics | AHRQ, NCQA, CAHPS | Claims, Medical Record, Survey | No |
| Domain 3, D (Asthma) | All claims metrics listed in DSRIP Strategies Menu and Metrics | AHRQ, NCQA | Claims | No |
| Domain 4 | Age–adjusted preventable hospitalizations rate per 10,000–aged 18+ years | SPARCS | Yes | |
| Domain 4 | Asthma ED visit rate per 10,000 | SPARCS | Yes | |
| Domain 4 | Asthma ED visit rate per 10,000 (aged 0–4) | SPARCS | No | |
| Domain 4 | Age–adjusted heart attack hospitalization rate per 10,000 | SPARCS | Yes | |
| Domain 4 | Rate of hospitalizations for short–term complications of diabetes per 10,000 (aged 6–17 years) | SPARCS | No | |
| Domain 4 | Rate of hospitalizations for short–term complications of diabetes per 10,000 (aged 18+ years) | SPARCS | No |
*Note: information in the above table is taken directly from the DSRIP Strategies Menu and Metrics, when completed.
D.2 Data:
Given the IE´s interest in the above variables, they have identified the following data sets that will aid in their comparative analysis:
- Medicaid and Medicare Claims. These data will be the primary source of data for their analyses. These data will house the details related to many of the metrics referenced above.
- SPARCS. The data related to a number of the aforementioned measures is stored in the SPARCS database. Use of these data will allow the IE to investigate key metrics and compare across PPS.
- MDS (long–term care). For measures specific to long–term care (e.g., Domain 3, Behavioral Health, percent of long stay residents who have depressive symptoms).
- CAHPS©. The use of CAHPS ©data will allow the IE to learn about variations in service experience and patient satisfaction during the DSRIP program and examine the linkage between organization–level patient experience and individual–level outcomes.
D.3 Clustering to create PPS comparison groups.
The IE´s approach will begin by clustering PPS to compare those that have adopted specific domains and projects within those domains versus those that did not. More specifically, this will allow the IE to understand broadly, the impacts of PPS that elected projects addressing asthma care to those that did not. A second approach the IE will use is to cluster PPS based on their Domain 2 and Domain 3 selections. For example, several PPS selected 2.b.iv. (Care Transitions to reduce 30–day readmissions) and 3.b.i (Evidence–based strategies for disease management in high–risk/affected populations), whereas others selected one of the above or neither. The IE would cluster these groups of PPS to create comparison groups and examine specific metrics, such as readmission rates. This approach will identify the potentially most impactful Domain 2 and 3 projects.
Tests of statistical significance will be used to determine whether material differences exist between PPS. For measures available at the aggregate level for each PPS, the IE can only examine the bivariate association between the presence of a specific domain or project (or the level of implementation for that project) and the outcome variable. In that case, the IE will employ chi–square analysis to understand if differences are significant. However, in the case that outcome variables are available at the individual level (e.g., from Medicaid claims), the IE can control for patient characteristics via multivariate, multilevel modeling because they will have individuals nested via attribution in each PPS.
Then, to provide further context for these findings, the IE will use key informant interview and survey data previously gathered by the IE to contextualize "how" certain PPS have implemented project–specific plans and better understand "why" certain strategies may have been more or less effective in the context of comparative analysis.
D.4 DID.
The IE will use a Difference In Difference (DID) estimation methodology to examine specific performance measures in the time before and after the implementation of the DSRIP program comparing PPS involved in specific interventions to those that were not engaged in those projects. This estimation strategy adjusts for time–based variations in outcomes, helping determine program impacts from other phenomena. Moreover, this approach will give the IE an aggregate understanding as to whether the overall picture has changed for specific domains based on key measures of interest defined in the New York State DSRIP Strategies Menu and Metrics.
This approach will also require the use of risk–adjusted measures. This will be ideal because it would level the playing field in terms of dual–eligible and SSI patients as these individuals tend to seek care at distinct locations and are typically–high utilizers of care. Also, prior to carrying out this analysis, the IE will endeavor to identify patients and providers (hospitals and medical groups) who were not involved in any DSRIP PPS and understand the trends in use, quality, and spending over time in a separate DID analysis.
D.5 Patient–level comparisons.
The IE will examine trends within and across PPS with respect to patient–level outcomes. In particular, the IE will focus such comparisons on factors including age, sex, race, presence of chronic conditions, and mental health/substance abuse to inform their understanding of patients´ service experience and satisfaction during the DSRIP program. Such analyses will require the use of CAHPS data to examine patient satisfaction scores. However, because CAHPS scores/responses are typically not attributed to specific patients and are only available at the department, hospital, medical group, physician, or health plan level, the IE will need to examine the organizational–level CAHPS scores and their relationship to patient–level outcomes for populations attributed to the specific organization (at multiple levels). To effectively conduct such an analysis, the IE will build upon the approach set forth by Sequist, et al. (2008) to deal with the lack of individual–level outcome data linked to CAHPS scores.
Because the IE knows the Medicaid population can be vulnerable to income status changes and other reasons for disenrollment, they will determine inclusion criteria based upon months enrolled over each 12–month time period for specific measures (e.g., HEDIS–based quality measures often require 11 months of enrollment) and gaps in coverage. When considering other measures (e.g., spending and patient experience), all Medicaid members will be included for the months they were enrolled over the 36–month program and the 12–month look–back period for pre–DSRIP data.
D.6 Analytic Methods:
NYSDOH responded in November 2017 to CMS´s request to show what specific hypotheses will be tested, what data and analytic methods will be employed to address each research question, samples to employed, statistical or qualitative evidence to be examined, and how conclusions will be drawn. CMS suggested possible comparison strategies of a a.) Medicaid comparison group, b.) comparison based on differences in intensity of the intervention, c.) compare Medicaid and non–Medicaid trends in New York, and d.) compare trends in state and federal spending for the uninsured. NYSDOH responded that the IE will explore comparison groups as noted in a. and b. above, but some of the requested analysis is outside of the scope of the evaluation (contract), and that data sources are not available to address c. and d.
Clustering to create PPS comparison groups. The IE´s approach will begin by creating PPS– specific comparison groups by clustering PPS to compare those that have adopted specific domains and projects within those domains versus those that did not. More specifically, this will allow the IE to understand broadly, the impacts of PPS that elected projects addressing asthma care to those that did not. A second approach the IE will use is to cluster PPS based on their Domain 2 and Domain 3 selections. For example, several PPS selected 2.b.iv. (Care Transitions to reduce 30–day readmissions) and 3.b.i (Evidence–based strategies for disease management in high–risk/affected populations), whereas others selected one of the above or neither. The IE would cluster these groups of PPS to create comparison groups and examine specific metrics, such as readmission rates. This approach will identify the potentially most impactful Domain 2 and 3 projects.
Tests of statistical significance will be used to determine whether material differences exist between PPS. For measures available at the aggregate level for each PPS, the IE can only examine the bivariate association between the presence of a specific domain or project (or the level of implementation for that project) and the outcome variable. In that case, the IE will employ chi–square analysis to understand if differences are significant. However, in the case that outcome variables are available at the individual level (e.g., from Medicaid claims), the IE can control for patient characteristics via multivariate, multilevel modeling because they will have individuals nested via attribution in each PPS.
Then, to provide further context for these findings, the IE will use key informant interview and survey data previously gathered by the IE to contextualize "how" certain PPS have implemented project–specific plans and better understand "why" certain strategies may have been more or less effective in the context of comparative analysis.
DID. The IE will use a DID estimation methodology to examine specific performance measures in the time before and after the implementation of the DSRIP program comparing PPS involved in specific interventions to those that were not engaged in those projects. This estimation strategy adjusts for time–based variations in outcomes, helping determine program impacts from other phenomena. Moreover, this approach will give the IE an aggregate understanding as to whether the overall picture has changed for specific domains based on key measures of interest defined in the New York State DSRIP Strategies Menu and Metrics.
This approach will also require the use of risk–adjusted measures. This will be ideal because it would level the playing field in terms of dual–eligible and SSI patients as these individuals tend to seek care at distinct locations and are typically–high utilizers of care. Also, prior to carrying out this analysis, the IE will endeavor to identify patients and providers (hospitals and medical groups) who were not involved in any DSRIP PPS and understand the trends in use, quality, and spending over time in a separate DID analysis.
Patient–level comparisons. The IE will examine trends within and across PPS with respect to patient–level outcomes. In particular, the IE will focus such comparisons on factors including age, sex, race, presence of chronic conditions, and mental health/substance abuse to inform their understanding of patients´ service experience and satisfaction during the DSRIP program. Such analyses will require the use of CAHPS© data to examine patient satisfaction scores. However, because CAHPS© scores/responses are typically not attributed to specific patients and are only available at the department, hospital, medical group, physician, or health plan level, the IE will need to examine the organizational–level CAHPS© scores and their relationship to patient–level outcomes for populations attributed to the specific organization (at multiple levels). To effectively conduct such an analysis, the IE will build upon the approach set forth by Sequist, et al. (2008) to deal with the lack of individual–level outcome data linked to CAHPS© scores.
Because the IE knows the Medicaid population can be vulnerable to income status changes and other reasons for disenrollment, they will determine inclusion criteria based upon months enrolled over each 12–month time period for specific measures (e.g., HEDIS–based quality measures often require 11 months of enrollment) and gaps in coverage. When considering other measures (e.g., spending and patient experience), all Medicaid members will be included for the months they were enrolled over the 36–month program and the 12–month look–back period for pre–DSRIP data.
D.7 Implementation/Process Evaluation:
To assess the implementation of DSRIP initiatives, the IE will conduct a mixed method (quantitative and qualitative) evaluation. This evaluation will focus on the existing structures prior to DSRIP, process factors that shaped each program/project, program implementation strategies utilized by each site, and will complement the comparative and time series analyses. Quantitative data will be obtained through enrollment data, program data, and Medicaid claims data to determine how many participants are receiving services, whether the target populations are being reached by the initiatives, which services are being provided, the amount of services provided, and how these services are integrated. Qualitative data will be collected to extend and contextualize the quantitative measures. Sources include focus groups, semi–structured key informant interviews with PPS administrators and staff, and surveys of providers with semi– structured interview follow–up.
Quantitative and qualitative data will be used to aid in the understanding of several outcomes of interest. Outcomes of interest are based on the required RQs above. Quantitative and qualitative measures will be derived from different sources (e.g., qualitative data are based on analysis of patterns and responses via Atlas–TI, a qualitative data software program).
| Outcome | Data |
|---|---|
| Quantitative: | |
| Avoidable hospital use | 3M, AHRQ, Medicaid Claims |
| Health care cost | Change in spending over time from Medicaid claims, compared to national Medicaid spending growth trend |
| Quantitative: | |
| PPS achievement of health care transformation | Interviews with administrators, focus groups with providers, surveys with providers |
| Health care quality improvement | Interviews with administrators, focus groups with providers, surveys with providers |
| Population health improvement | Interviews with administrators, focus groups with providers, surveys with providers |
| Use of behavioral health care services | Interviews with administrators, focus groups with providers, surveys with providers |
| Successes and challenges of planning, implementation, and operation | Interviews with administrators, focus groups with providers, surveys with providers, surveys with patients |
D.8 Triangulation of Data Analyses:
In the final stage of the IE´s analysis, findings from the different analyses and sources (quantitative and qualitative) will be triangulated to develop an integrated analysis. Such data will be derived from multiple sources including Medicaid and Medicare claims, SPARCS, MDS, focus groups, key informant interviews, surveys, etc. Building on the findings from the time– series analysis, qualitative analysis, and comparative analysis, the IE will synthesize the results and present interim and final summary reports that will provide insight into the effectiveness of the DSRIP program.
The IE designed the evaluation to specifically address the diversity of initiatives under the DSRIP program. The implementation/process evaluation will provide a detailed description of the programs to set the context for the time series and outcomes analyses. The IE will also address the methodological challenges of evaluating initiatives that differ in focus and target population by carefully refining the evaluation plan based on further information provided by NYSDOH. In the design, the IE selected comparison groups based on the information available at the time of the competitive procurement, but will reevaluate this and other components of the evaluation based on updated and detailed information from NYSDOH. The IE will leverage the relationships and experiences that the University at Albany (UA) research team has with the Boston University School of Public Health (BUSPH) and University of Maryland School of Public Health (UMSPH) team to facilitate a responsive, comprehensive evaluation for NYSDOH that provides timely, useful information to guide future decisions.
D.9 Data Collection Plan:
Quantitative Data. All datasets are available through NYSDOH. The process of accessing the data (e.g., Medicaid claims, SPARCS) will begin immediately following the start date of the IE´s contract with NYSDOH. Once obtained, data cleaning, management, and analyses will begin and continue throughout the duration of the evaluation.
Qualitative Data. These data will look at the overall planning and implementation of DSRIP, operation of each PPS as a whole, as well as successes and challenges of projects within the PPS. The comparative analysis will be conducted jointly with the data collection activities of the IE, as to not duplicate efforts and to ensure alignment between the comparative analysis goals and the variables created via the qualitative data collection activities.
Data collection will occur annually, coinciding with each demonstration year of the DSRIP program (April 1 to March 31). It is important that the evaluation timeline follow the project timeline in order to provide appropriate and meaningful annual feedback to PPS. In addition, maintaining this timeline is important for comparative analysis based on funding, etc. Each year, the IE plans to collect information from data sources (interviews, survey with patients, and survey with providers) for each of the PPS. Focus groups will be conducted once each year over the course of data collection for each PPS. Data collection will include researchers visiting the PPS for data collection (e.g., focus groups and interviews), as well as online and telephone data collection (e.g., surveys and interviews).
D.10 Anticipated Challenges and Mitigation Strategies:
Like any empirical project of this depth, the IE is anticipating several challenges and roadblocks. Given the nature of this project, challenges may be associated with
- Matching large datasets
- Handling missing data.
These first two challenges are common when dealing with large and complex data sets. The IE´s subject matter experts and programmers will write algorithms based on common identifiers to link the datasets for challenge #1. To mitigate challenge #2, the IE will assess the issues as they present and determine what, if any, imputation approaches may be necessary.
- Medicaid beneficiaries who frequently go in and out of covered status
- Medicaid beneficiaries who move across PPS throughout the demonstration period
- Initiation of interventions (DSRIP projects) as some PPS may have started earlier than others
- Distinct differences in culture and outcomes between early adopters and late adopters of specific activities and/or projects
To address the challenges in #3–6, the triangulation of analyses will overcome many of these challenges. For example, with respect to #3 and 4, these issues may be mitigated by using the individual level observations as some of these variations over time will not be apparent at the PPS unit of analysis. Moreover, challenge #6 can be addressed during key informant interview with program managers and PPS leadership, as well as surveys of each PPS.
- Recruiting and connecting with stakeholders for participation in data collection
- Methodological challenges of evaluating PPS with different projects and strategies
- Evaluating the full implementation of a five–year demonstration project, when data collection is starting in the middle of the demonstration period
Since many providers are very busy with their work, it may be a challenge to recruit participants for focus groups and/or key informants. The IE will mitigate #7 by explaining the purpose of the group to the providers and emphasizing how important their input is to the evaluation. Because providers have an interest in improvement of their projects and achieving the highest–level payment attainable, evaluation is likely to be of interest to them. In addition, the IE has designed data collection to be more flexible by incorporating a survey into the data collection methods that can be completed when it is convenient for providers, rather than having to convene providers for additional groups.
Comparisons across PPS may be challenging because all of the PPS are implementing different projects and strategies. One way to mitigate #8 is to focus on similarities between PPS and cluster PPS by projects or disease foci. For instance, all PPS are implementing behavioral health projects. Across all PPS, the IE can consider aspects of this project type, such as what strategies were successful, what challenges were specific to a strategy or were pervasive across all projects in the same domain.
Given that the DSRIP program has already started, joining mid–stream may present challenges to the IE (see #9). Ideally, program evaluations occur concurrently with the development and operation of a program. This way, data prior to the implementation of programs is compared to data during and after the implementation of programs to assess change. To mitigate this strategy, NYSDOH has insured the IE will have comprehensive access to Medicaid claims, SPARCS, and other data reported by the PPS participants. However, because the evaluation is beginning in the middle of the demonstration project, this presents a challenge for qualitative data collection focusing on the initial implementation of the DSRIP program and the individual projects. This may introduce bias when seeking to learn about the initial steps in DSRIP project development and implementation. One way to mitigate this issue is to ask respondents how things have changed since before the implementation and since the earlier stages of implementation.
Retrospective data collection is not ideal but is still able to capture perceptions of change from participants. In addition, qualitative evaluation for the remaining 2.5 years of the demonstration project will be collected in real time, which will provide context and information regarding the operation and planned sustainability of projects.
|top of Section D.| |top of page|Section E:
Detailed Table for Independent Evaluation of the New York DSRIP Demonstration (7/24/17):
The Independent Evaluation is built to investigate the DSRIP demonstration goals. The table below represents the three arms of the evaluation with clarification on how the arms will investigate their own RQs and hypotheses that correspond to the demonstration goals. The table is presented in this format to provide clarity of the investigation approach. Sections B, C, and D provide more detailed information regarding exact approaches the IE will pursue in the evaluation of the DSRIP demonstration goals. The summary of the evaluation questions, measures, data, and methods is below.
| Research Question and Hypotheses | Outcome measures used to address the research question | Sample or population subgroups to be compared | Data Sources | Analytic Methods |
|---|---|---|---|---|
| Time Series Analysis | ||||
| To what extent did Performing Provider Systems achieve health care system transformation, including increasing the availability of behavioral health care? Hypothesis 1: Integration of service delivery will improve under DSRIP as seen in increased availability of primary and behavioral health services for Medicaid beneficiaries. Hypothesis 2: Care coordination will increase under DSRIP as seen through increased utilization of primary care services among Medicaid beneficiaries. Hypothesis 3: Expenditures for primary care will increase under DSRIP among Medicaid beneficiaries. Hypothesis 4: Use and expenditures for outpatient behavioral health will increase under DSRIP among Medicaid beneficiaries. Hypothesis 5: Medicaid utilization and expenditures for ED and inpatient services will decrease under DSRIP. Hypothesis 6: Utilization and expenditures for ED and inpatient services among the uninsured will decrease under DSRIP. |
– Use and expenditures for Primary Care Services for Medicaid beneficiaries – Use and expenditures for behavioral health services for Medicaid beneficiaries – Medicaid expenditures and utilization for emergency department (ED) and inpatient services. Utilization and expenditures for ED and inpatient services for the uninsured Project specific outcomes to be selected from Att. J, pages 10–21 |
– All attributed Medicaid Beneficiaries affected by DSRIP control beneficiaries as can be identified and uninsured who have ED or inpatient utilization –Intra and Inter– PPS | – Medicaid Claims Data, SPARCS data | – Descriptive Statistics over time to see trends –Comparative Interrupted Times Series Analysis & Interrupted Time Series Analysis to study the mechanics behind the trends |
| Did health care quality improve because of clinical improvements in the treatment of selected diseases and conditions? Hypothesis 1: Through clinical improvements under DSRIP, health care utilization in the inpatient and ED settings will decrease for all conditions examined for Medicaid beneficiaries. Hypothesis 2: Through clinical improvements under DSRIP, post discharge mortality rates will decrease for all conditions considered for Medicaid beneficiaries. Hypothesis 3: Through clinical improvements under DSRIP post discharge mortality rates will decrease for all conditions considered for the uninsured. |
Hospital admissions and readmissions for: – Behavioral Health – Cardiovascular Health – Diabetes – Asthma – HIV/AIDS – Renal disease – Perinatal care – Palliative care ED utilization for: – Behavioral Health – Cardiovascular Health – Diabetes – Asthma – HIV/AIDS – Renal disease – Perinatal care – Palliative care Mortality rates post discharge from inpatient and ED settings for: – Behavioral Health – Cardiovascular Health – Diabetes – Asthma – HIV/AIDS – Renal disease – Perinatal care – Palliative care – Project–specific outcomes to be selected from Attachment J, pages 10–21 |
– All attributed Medicaid Beneficiaries affected by DSRIP and control Medicaid beneficiaries who can be identified – Intra– and inter– PPS analysis – Uninsured who utilize services in the inpatient or ED settings |
– Medicaid Claims Data, SPARCS data, VR (death) data | – Descriptive statistics – Comparative Interrupted Time Series Analysis |
| RQ: Did population health improve as a result of implementation of the DSRIP initiative? Hypothesis 1: Preventive mental health and substance use services will increase under DSRIP. Hypothesis 2: Preventive HIV and STD services will increase under DSRIP. Hypothesis 3: Maternal mortality rates of Medicaid beneficiaries will decrease under DSRIP. Hypothesis 4: Infant mortality rates of Medicaid beneficiaries will decrease under DSRIP. |
– Outpatient mental health or substance use services – Outpatient screening for HIV/AIDS and STDs – Outpatient services and expenditures for HIV/AIDS and STDs – Mortality rates for mothers and infants |
– All attributed Medicaid beneficiaries affected by DSRIP and possible control beneficiaries – Mortality rates for Medicaid and general population |
Medicaid Claims data, VR (death data) | – Descriptive statistics – Comparative Interrupted Time Series Analysis |
| RQ: What is the role of DSRIP in promoting behavioral health care? Hypothesis 1: Utilization and expenditures for outpatient behavioral health services for Medicaid beneficiaries will increase under DSRIP. Hypothesis 2: Utilization and expenditures for inpatient behavioral health services for Medicaid beneficiaries will decrease under DSRIP. Hypothesis 3: Utilization and expenditures for ED behavioral health services for Medicaid beneficiaries will decrease under DSRIP. Hypothesis 4: Utilization and expenditures for inpatient behavioral health services for uninsured will decrease under DSRIP. Hypothesis 5: Utilization and expenditures for ED behavioral health services for uninsured will decrease under DSRIP. |
– Percentage of adults with poor mental health and substance use disorders in Medicaid and general population – Outpatient mental health and substance use services Inpatient mental health and substance use services ED visits for mental health and substance use services |
– All attributed Medicaid Beneficiaries affected by DSRIP and possible control beneficiaries Uninsured in inpatient and ED settings – Inter–PPS analysis |
– Medicaid Claims Data, SPARCS data, BRFSS | – Descriptive statistics – Interrupted Time Series Analysis |
| RQ: Was Avoidable Hospital Use Reduced because of DSRIP? Hypothesis 1: Expenditures for inpatient and ED visits will be slowed our decreased under DSRIP. Hypothesis 2: Utilization of ED and inpatient services will decrease under DSRIP. Hypothesis 3: Post–hospital death rates will decrease under DSRIP |
– Potentially–preventable ED visits – Potentially–preventable hospital readmissions – Potentially–preventable hospital admissions – Post–hospital mortality rates – Various claims metrics listed in Attachment J, p. 10–21, for matching the intervention and control groups as feasible |
– All attributed Medicaid beneficiaries affected by DSRIP – Inter–PPS analysis – Medicaid and Non–Medicaid subpopulations |
– Claims data, SPARCS data, VR (death) data | – Descriptive statistics – Interrupted Time Series Analysis – Propensity Score matched DID for comparing Medicaid and Non–Medicaid populations |
| RQ: Did DSRIP reduce health disparities? Hypothesis 1: The mortality rates among racial/ethnic classes will be more equal under DSRIP. Hypothesis 2: The percentage of beneficiaries with mental health or substance use disorders will be more equal under DSRIP. Hypothesis 3: Avoidable inpatient utilization will become lower among all racial/ethnic classes under DSRIP. Hypothesis 4: Avoidable ED visits will become lower among all racial/ethnic classes under DSRIP. |
– Mortality rates by racial/ethnic class – Percentage with mental health or substance use disorder by racial/ethnic class – Avoidable hospital utilization by racial/ethnic class – Avoidable ED visits by racial/ethnic class |
– All attributed Medicaid Beneficiaries affected by DSRIP and possible control beneficiaries by racial/ethnic class – Adult population in NYS – Inter–PPS analysis |
– Claims data, SPARCS data, BRFSS, VR (death) data | – Descriptive statistics – Interrupted Time Series Analysis |
| RQ: Did DSRIP reduce health costs? Hypothesis 1: Health care expenditures associated with services under DSRIP will be reduced or lowered. |
– Medicaid Spending in total | – All attributed Medicaid beneficiaries affected by DSRIP and possible control beneficiaries – Inter–PPS analysis |
– Medicaid Claims Data, SPARCS data | – Descriptive statistics
– Interrupted Time Series Analysis |
| RQ: Was DSRIP cost effective in terms of NYS and federal government receiving adequate value for their investment? | – Medicaid expenditures pre– and post–DSRIP – Costs of implementing DSRIP by PPS and total over time – Costs of Medicaid program pre– DSRIP |
– All attributed Medicaid beneficiaries affected by DSRIP and control beneficiaries in pre– and post– periods – Providers for PPS and non– PPS groups |
Medicaid claims data, Independent Assessor information on costs of implementing DSRIP, Medicaid budget appropriations for non–DSRIP Medicaid program | Incremental Cost Effectiveness Analysis |
| Qualitative Analysis | ||||
| What services are being provided in each project dimension? | – Categorization and itemization of services in each dimension – PPS and provider–led identification of services in each project dimension – Provider assessment of projects |
– Engaged DSRIP Providers (defined as providers who are contractually involved with one or more PPS sponsored DSRIP projects) who have email based contacts with the PPS, PPS administrators | – Surveys with engaged providers (sampling frame of 2,400 providers who are engaged in projects with every PPS in all provider categories) – Key informant interviews with PPS administrators (year 1: 25 interviews with administrators year 2: 25 interviews with PPS project leads; year 3: 25 interviews with administrators). |
Descriptive statistics of survey responses; Qualitative analysis of interview material |
| What are the most critical components of each project? | – PPS and provider–led assessment of projects – Critical component case studies |
– Engaged DSRIP Providers; PPS administrators (see definitions and sample frame above) | – Focus groups with engaged providers with probing for examples – Surveys with engaged providers with open ended space for examples – Key informant interviews with PPS administrators with probing for examples. |
– Descriptive statistics of survey responses – Qualitative analysis of interview material, open– ended survey questions, and focus groups |
| Have the selected projects been implemented as designed/intended (e.g., modifications or adaptions, consistency with program design, fidelity to a model?) | – PPS and Provider–led assessment of fidelity to project operation and implementation – Identification of adaptations to design –– – Challenges and successes with implementation – Utility of scale and speed items – Utility of IA assessments – Utility of other DOH milestones. |
Engaged DSRIP Providers, PPS administrators | Focus groups with engaged providers, Surveys with engaged providers; key informant interviews with PPS administrators | Descriptive statistics of survey responses; Qualitative analysis of interview material, open–ended survey questions, and focus groups |
| How well does the program connect with other programs and services received by participants? | – PPS and partner– led assessment of program integration – Composite ratings of program – Examples and case studies of integration – Patient rating of coordination of care |
Engaged DSRIP Providers, PPS administrators, patients | Focus groups with engaged providers, Surveys with engaged providers; key informant interviews with PPS administrators; patient survey | Descriptive statistics of survey responses; Qualitative analysis of interview material, open–ended survey questions, and focus groups |
| What are the key factors in the project´s environment (e.g., the larger community, the network of services, community based organizations) that influence project implementation? | – Categorization and itemization of factors in project environment; – PPS and Partner led assessment of those factors – Case studies and examples of those factors |
Engaged DSRIP Providers, PPS administrators, managed care organization representatives | Focus groups with engaged providers, Surveys with engaged providers; key informant interviews with PPS administrators, surveys with managed care organizations | Descriptive statistics of survey responses; Qualitative analysis of interview material, open–ended survey questions, and focus groups |
| What barriers or challenges been encountered during service delivery? | – Categorization and itemization of barriers and challenges – PPS–led assessment of barriers and challenges – Partner–led assessment of barriers and challenges – Examples and case studies |
Engaged DSRIP Providers, PPS administrators | Focus groups with engaged providers, Surveys with engaged providers; key informant interviews with PPS administrators | Descriptive statistics of survey responses; Qualitative analysis of interview material, open–ended survey questions, and focus groups |
| What strategies have been utilized? What were there outcomes? | – Success and challenges of planning, implementation and operation categorization of strategies – PPS–led assessment of those strategies – Partner–led assessment of those strategies – Examples and case studies of those strategies |
Engaged DSRIP Providers, PPS administrators | Focus groups with engaged providers, Surveys with engaged providers; key informant interviews with PPS administrators | Descriptive statistics of survey responses; Qualitative analysis of interview material, open–ended survey questions, and focus groups |
| How have other health care initiatives impacted DSRIP? | – Itemization of other health care changes – PPS and partner–led assessment of other initiatives – Case studies and examples of impacts |
Engaged DSRIP Providers, PPS administrators, patients, managed care organizations | Focus groups with engaged providers, Surveys with engaged providers; key informant interviews with PPS administrators; surveys with managed care organizations | Descriptive statistics of survey responses; Qualitative analysis of interview material, open–ended survey questions, and focus groups |
| How satisfied are DSRIP stakeholders with program planning? | – Rating of satisfaction with program planning from PPS, Partners, Patients, Managed Care – Case studies and examples of satisfaction and dissatisfaction with program planning–PPS achievement of healthcare transformation |
Engaged DSRIP Providers, PPS administrators, patients, managed care organization representatives | Focus groups with engaged providers, Surveys with engaged providers; key informant interviews with PPS administrators, patient surveys, surveys with managed care organization representatives | Descriptive statistics of survey responses; Qualitative analysis of interview material, open–ended survey questions, and focus groups |
| How satisfied are DSRIP stakeholders with program implementation and operation? | – Rating of satisfaction with program implementation from PPS, Partners, Patients, Managed Care – Rating of satisfaction with program operation from stakeholders – Case studies and examples of satisfaction and dissatisfaction of both implementation and operation |
Engaged DSRIP Providers, PPS administrators, patients, managed care organization representatives | Focus groups with engaged providers, Surveys with engaged providers; key informant interviews with PPS administrators, patient surveys, surveys with managed care organization representatives | Descriptive statistics of survey responses; Qualitative analysis of interview material, open–ended survey questions, and focus groups |
| What changes have there been to health care system overall? | – Itemization of changes to health care system over demonstration years – PPS and provider led assessment of changes to health care – Patient–led assessment of changes to l health care – Managed care–led assessment of changes to health–PPS achievement of healthcare transformation |
Engaged DSRIP Providers, PPS administrators, patients, managed care organization representatives | Focus groups with engaged providers, Surveys with engaged providers; key informant interviews with PPS administrators, patient surveys, surveys with managed care organization representatives | Descriptive statistics of survey responses; Qualitative analysis of interview material, open–ended survey questions, and focus groups |
| What changes have there been behavioral health care? | – Itemization of changes to behavioral health care over demonstration years – PPS and provider led assessment of changes to behavioral health care – Patient–led assessment of changes to behavioral health care – Managed care– led assessment of changes to behavioral health |
Engaged DSRIP Providers, PPS administrators, patients, managed care organization representatives | Focus groups with engaged providers, Surveys with engaged providers; key informant interviews with PPS administrators | Descriptive statistics of survey responses; Qualitative analysis of interview material, open–ended survey questions, and focus groups |
| What changes has there been to population health? | – Itemization of changes to population health over demonstration years – Patient–led assessment of changes to population health – Managed care–led assessment of changes to public health – Case studies of population health projects at each PPS – PPS and provider–led assessment of changes to population health |
Engaged DSRIP Providers, PPS administrators, patients, managed care organization representatives | Focus groups with engaged providers, Surveys with engaged providers; key informant interviews with PPS administrators, patient surveys, surveys with managed care organization representatives | Descriptive statistics of survey responses; Qualitative analysis of interview material, open–ended survey questions, and focus groups |
| How effective do DSRIP stakeholders perceive the projects to be? Perceive DSRIP to be overall? |
– PPS achievement of healthcare transformation – Success and challenges of planning, implementation and operation – Rating of projects and DSRIP overall – PPS– led Rating of effectiveness of projects and DSRIP – Partner assessment of projects |
Engaged DSRIP Providers, PPS administrators | Focus groups with engaged providers, Surveys with engaged providers; key informant interviews with PPS administrators | Descriptive statistics of survey responses; Qualitative analysis of interview material, open–ended survey questions, and focus groups |
| Which participants seem to be benefiting the most and the least? Why? | – PPS and provider–led assessment of benefits from DSRIP – Examples of major changes; Patient assessment of care and changes to care |
Engaged DSRIP Providers, PPS administrators, patients, managed care organization representatives | Focus groups with engaged providers, Surveys with engaged providers; key informant interviews with PPS administrators, patient surveys, surveys with managed care organization representatives | Descriptive statistics of survey responses; Qualitative analysis of interview material, open–ended survey questions, and focus groups |
| What recommendations are offered regarding DSRIP improvement? | – PPS and provider–led project–specific improvements, DSRIP improvements | Engaged DSRIP Providers, PPS administrators | Focus groups with engaged providers, Surveys with engaged providers; key informant interviews with PPS administrators; surveys with patients | Descriptive statistics of survey responses; Qualitative analysis of interview material, open–ended survey questions, and focus groups |
| How has the patient experience changed? | – Patient reported assessment of experiences of changes to care – Changes to patient reported rating of provider compared to DSRIP milestones over project (e.g. VBP) – Changes to patient reported assessment of doctor communication |
Engaged DSRIP Providers, PPS administrators; Patients who use Medicaid | Focus groups with engaged providers, Surveys with engaged providers; key informant interviews with PPS administrators; surveys with patients | Descriptive statistics of survey responses; Qualitative analysis of interview material, open–ended survey questions, and focus groups |
| How satisfied are patients with the change? | – Patient reported assessment of experiences with care – Patient reported rating of provider – Patient reported assessment of doctor communication – Patient reported care coordination; – Provider level assessment of patient satisfaction with change |
Engaged DSRIP Providers, PPS administrators; Patients who use Medicaid | Focus groups with engaged providers, Surveys with engaged providers; key informant interviews with PPS administrators; surveys with patients | Descriptive statistics of survey responses; Qualitative analysis of interview material, open–ended survey questions, and focus groups |
| Comparative Analysis | ||||
| RQ: Where does variation exist in the strategies implemented by PPSs when a similar strategy(s) were selected? Hypothesis 1: PPS that implement projects in a specific area of a domain (e.g., asthma, Domain 2) will experience comparatively better performance on related outcomes than PPS that did not implement projects in this area of a domain. Hypothesis 2: PPS that implement projects in a specific area of a domain (e.g., asthma, Domain 2) will experience comparatively better performance following the intervention. |
– Potentially avoidable ER visits –Potentially avoidable readmissions – various claims metrics listed in Attachment J |
– Quantitative Data: claims data, SPARCS data, vital records data – Qualitative Data: Key informant interviews, focus groups, surveys – PPS Characteristics to be used to identify comparison sub–groups: The primary characteristics that will be used to distinguish between PPS sub–groups will be project selections. Additional controls that will be included in the models may include: attribution size, number of hospitals and physicians, aggregate patient characteristics such as average age, % race, etc. |
– Directed content analysis – Interrupted Time Series Design |
|
| RQ: How does the relative effectiveness of particular projects intended to produce the same outcome differ among the PPSs? Hypothesis: PPS that select certain projects for a specific domain (e.g., asthma, Domain 2) will experience comparatively better performance on related outcomes than those PPS that selected other projects. |
– Potentially avoidable ER visits – Potentially avoidable readmissions – various claims metrics listed in Attachment J; project specific outcomes to be selected from Attachment J, pages 10–21 |
– Quantitative Data: claims data, SPARCS data, vital records data – Qualitative Data: Key informant interviews, focus groups, stakeholder surveys |
– Directed content analysis –ITS |
|
| RQ: What similarities exist among those PPSs receiving (or not receiving) maximum payment based on project valuation? Hypothesis: PPS that achieve a higher percentage of their maximum payment based on project valuation will have higher overall performance on similar outcomes. |
– Potentially avoidable ER visits – Potentially avoidable readmissions – various claims metrics listed in Attachment J, pages 10–21 |
– Quantitative Data: claims data, SPARCS data, vital records data –Qualitative Data: Key informant interviews, focus groups, surveys | – Directed content analysis –ITS | |
| RQ: What regional differences exist between PPS´s operating in different regions of New York? RQ: What successes and challenges are associated with local resources or procedures? Hypothesis: PPS in the NYC boroughs will have made greater improvements during the demonstration period among similar outcomes than other regions of NYS. |
– Potentially avoidable ER visits – Potentially avoidable readmissions – various claims metrics listed in Attachment J |
– Quantitative Data: claims data, SPARCS data, vital records data – Qualitative Data: Key informant interviews, focus groups, surveys |
– Directed content analysis –ITS | |
| RQ: What patient–level differences exist in terms of service experience and satisfaction? Hypothesis 1: Older adults will have comparatively lower scores in service experience and satisfaction than younger adults on similar DSRIP– related outcomes. Hypothesis 2: Female patients will report higher levels of satisfaction than males on similar DSRIP–related outcomes. |
CAHPS Measures (various) | –Surveys of patients using CAHPS survey data | Qualitative analysis of survey data | |
Section F:
Timeline of Evaluation Activities:
| Research Activities | 2016 | 2017 | 2018 | 2019 | 2020 | 2021 | ||||||||||||||
|---|---|---|---|---|---|---|---|---|---|---|---|---|---|---|---|---|---|---|---|---|
| Q4 | Q1 | Q2 | Q3 | Q4 | Q1 | Q2 | Q3 | Q4 | Q1 | Q2 | Q3 | Q4 | Q1 | Q2 | Q3 | Q4 | Q1 | Q2 | Q3 | |
| DY2 | DY3 | DY4 | DY5 | |||||||||||||||||
| Develop/ design protocols for IRB submission | X | |||||||||||||||||||
| IRB submission | X | |||||||||||||||||||
| DUA for Medicaid and other data executed | X | |||||||||||||||||||
| Schedule & perform key informant interviews | X | X | X | X | X | X | X | X | X | |||||||||||
| Schedule & perform focus groups | X | X | X | X | X | X | X | X | X | |||||||||||
| Transcribe, code, & analyze interview & focus group text | X | X | X | X | X | X | X | X | X | X | X | X | X | X | ||||||
| Design web-based survey | X | |||||||||||||||||||
| Administer web-based survey | X | X | X | X | X | X | X | X | X | |||||||||||
| Analyze web-based survey data | X | X | X | X | X | X | X | X | X | X | ||||||||||
| Receive Medicaid claims data | X | X | X | X | X | X | X | X | ||||||||||||
| Submit request for SPARCS & other data | X | |||||||||||||||||||
| Receive SPARCS & other data | X | X | X | X | ||||||||||||||||
| Data cleaning & preparation | X | X | X | X | X | X | X | X | X | X | X | X | X | X | ||||||
| Data analysis | X | X | X | X | X | X | X | X | X | X | X | X | X | X | ||||||
Expanded Timeline for Evaluation Milestones:
| Milestone | Target Date |
|---|---|
| Qualitative Analysis: | |
| Finalize key informant interview guides | 4/28/17 |
| Introduce recruitment of key informant interviews to PPS staff via email blast | 5/22/17 |
| Introduce web–based survey to PPS staff and DSRIP associated providers via email | 6/9/17 |
| Begin scheduling of key informant interviews via telephone and hold key informant interviews | 6/14/17 |
| Finalize focus group guides | 7/30/17 |
| Finalize content of web–based survey for DSRIP associated providers | 7/30/17 |
| Introduce recruitment of DSRIP–associated providers for focus groups via email | 8/14/17 |
| Begin analyses of incoming data from focus groups, key informant interviews, surveys with DSRIP–associated providers, and surveys with patients | 8/15/17 |
| Complete research cycle 1 key informant interviews with PPS staff | 9/22/17 |
| Launch web–based survey for DSRIP associated providers | 9/25/17 |
| Launch focus groups at 8 PPS sites with DSRIP–associated providers | 11/9/17 |
| Finalize patient survey content | 11/1/17 |
| Launch patient survey | 1/1/18 |
| Complete cycle 1 web–based survey with PPS staff/community partners | 12/21/17 |
| Complete evaluation year 1 focus groups with DSRIP–associated providers | 12/21/17 |
| Complete cycle 1 web–based survey with patients | 2/15/18 |
| Complete analyses of cycle 1 data | 2/28/18 |
| Prepare for launch of cycle 2 research activities (key informant interviews, focus groups, and surveys) | 3/15/18 |
| Prepare for launch of cycle 3 research activities (key informant interviews, focus groups, and surveys) | 3/15/19 |
| Mixed Methods Analysis: | |
| Meet with NYSDOH to explore data needs and uses of Salient data, etc. | 5/15/17 |
| Gain access to Medicaid, quality metric data, and other data (MDW) | 11/17/17 |
| Gain access to SPARCS data | 11/28/17 |
| Gain access to Vital Records | 11/28/17 |
| Training on MDW data for staff using data | 8/9/17 |
| Receive MDW, SPARCS, and Vital Records data (through most recent data available) via VPN | TBD |
| Begin establishing baseline data prior to start of DSRIP | TBD |
| Perform descriptive statistics on baseline data prior to start of DSRIP for all PPS | TBD |
| Receive data from qualitative team collected from initial key informant interviews, focus groups, and surveys | 1/31/18 |
| Begin comparative analysis examining first two demonstration years data to baseline | 3/31/18 |
| Conduct mixed methods analysis of quantitative and qualitative data for Comparative Analysis. | 9/31/18 9/31/19 9/31/20 |
| Quantitative Analysis: | |
| Acquire access to MDW | 1/31/18 |
| Establish HCS accounts for all DSRIP evaluators | 6/29/17 |
| MDW data training | Ongoing |
| Gain access to MDW via VPN provided by NYSDOH (phase 2) | 4/1/18 |
| Get access to NYSDOH "sandbox" for availability of SPARCS, Vital Records, MDW, and DSRIP on same framework | 1/31/18 |
| Clean available datasets conforming to research questions | Ongoing |
| Obtain descriptive statistics and trend of main indicators pertaining to research questions | Ongoing |
| Begin time series analysis | 5/15/18 |
| Obtain preliminary results for time series RQs 1–6 | 12/31/18 |
| Begin data collection for cost effectiveness analysis | 1/1/19 |
| Obtain results for time series analyses | 12/31/19 |
| Preliminary results for cost effectiveness analysis | 1/1/20 |
| Final results for time series analyses | 8/30/20 |
| Conclusions for cost effectiveness analyses | 8/30/20 |
Section G:
Reports/Meetings:
1. Interim Evaluation Report – Per agreement between NYSDOH and CMS, this report must contain evaluation results from quantitative and qualitative data available for reporting and is due from the IE as follows:
| Draft due to NYSDOH for review | 2/15/19 |
| Draft due to CMS for review | 3/30/19 |
| Final due to NYSDOH for review | 5/15/19 |
| Final due to CMS | 6/30/19 |
2. Summative Evaluation Report – Per agreement between NYSDOH and CMS, this report must cover the entire five–year demonstration, and contain the major results and conclusions with respect to DSRIP´s operation and effectives. This will be the final report from the DSRIP evaluation. Content of the report is described in the STC above.
| Preliminary report due to NYSDOH for review | 5/15/20 |
| Preliminary report due to CMS | 6/30/20 |
| Draft final report due to NYSDOH for review | 11/15/20 |
| Final draft due to CMS | 12/28/20 |
| Final due to NYSDOH for review | 2/15/21 |
| Final due to CMS | 3/28/21 |
3. Annual Statewide Reports – For the first four years of the demonstration, annual summaries of major DSRIP evaluation results to be shared with state policymakers, PPS planners, administrators and providers in order to highlight areas of success and those in need of improvement, and to guide any needed program modifications and enhancements.
Each demonstration year´s annual report is due on March 31 of the following year. No annual statewide report is due for DY 5, as it will be replaced by the Summative Evaluation Report.
4. Annual PPS Reports – The IE will, on an annual basis for each of the five demonstration years, distribute results from interviews and surveys administered on the PPS level back to those PPS, with the expectation that receipt of information that is specific to their own projects will assist their ongoing quality improvement efforts.
Each demonstration year´s PPS report is due on March 31 of the following year.
5. Quarterly Reports – The IE will provide quarterly reports with updates to NYSDOH on data collection, analysis, and the status of written products, including activities completed during the quarter, and any difficulties encountered. These reports are due March 31, June 30, September 30, and December 30 of each year.
6. Meetings with CMS – The IE will, as necessary, participate in meetings/conference calls with CMS pertaining to New York´s DSRIP evaluation.
7. Cooperation with Federal Evaluation – The IE will cooperate with any federal evaluation activities that may be undertaken by CMS.
|top of Section G.| |top of page|Section H:
Staffing Requirements:
Though there are no specific staffing requirements, the appropriateness of the staffing plan was reviewed by NYSDOH according to the competitive procurement:
- Staffing is to adequately meet the project activities and deliverables. The staffing should demonstrate that project staff have appropriate training and experience in program evaluation, quantitative data analysis using large and complex data systems, survey and interview development, qualitative data collection and analysis, and report preparation. The IE provided a description of roles for each staff person, including the lead evaluator.
- Job descriptions are to detail staff qualifications for the position and are to include total hours per week and estimated hours dedicated to each major task. Where possible, a resume for each staff person is to be provided.
- A description of how internal management will be conducted for the DSRIP evaluation. Management oversight should be adequate to ensure integrity of products throughout the course of the DSRIP evaluation.
Appropriately staffing this project is a critical task and requires the coordination of subject matter experts and support staff from the University at Albany (UA), Boston University School of Public Health (BUSPH), and University of Maryland School of Public Health (UMSPH). The IE´s staffing plan is organized according to the activities involved in this evaluation (e.g., time series design, qualitative analysis, and comparative analysis). The internal management of evaluation activities is coordinated within each unit by the lead for that unit and the total evaluation is coordinated by the lead unit and by Diane Dewar, PhD, Principal Investigator.
The Research Foundation of the SUNY, Institute for Health System Evaluation (IHSE) will function as the coordinating entity for the entire evaluation. Dr. Dewar´s team of support staff will be comprised of four (4) individuals who will function as the adhesive that will connect the research activities going on across the evaluation. Brian Fisher, PhD, who is a Senior Research Associate within the IHSE, will also serve in a data preparation role and collaborate regularly with the Research Foundation of the SUNY, Econometrics Research Institute (ERI) and BUSPH teams. Two additional support staff will be used to manage daily activities and support the work of Dr. Fisher. This team will also ultimately be responsible for coordinating and submitting quarterly and annual reports to NYSDOH and the PPS.
UA IHSE Staffing:
| Team Member | Job Description (Key Tasks) | Level of Effort (as a % of 100% or 40 hours) |
|---|---|---|
| Diane Dewar, PhD, Principal Investigator, Director of IHSE and Associate Professor |
|
40% in Y1–Y5 |
| Brian Fisher, PhD, Senior Research Associate |
|
45% in Y1–Y5 |
| Sharleen Brittell Project Coordinator |
|
50% in Y1–Y5 |
| Graduate Research Assistant TBD |
|
50% in Y1–Y5 |
The UA Center for Human Services Research (CHSR) will serve as the qualitative team that will oversee all activities related to surveys, key informant interviews, and focus groups. Given the labor–intensive nature of the tasks inherent in this work, a number of qualified and trained staff is needed by the IE. Paloma Luisi will maintain oversight of these activities. Moreover, support staff including qualitative researchers, survey specialists, and graduate assistants will be included in the plan to ensure that the survey and protocol design is developed appropriately, surveys are administered and analyzed in a timely manner, and that key informant interviews and focus groups are conducted, transcribed, and analyzed properly.
UA CHSR Staffing:
| Team Member | Task | Level of Effort (as a % of 100% or 40 hours) |
|---|---|---|
| Paloma Luisi, MPH |
|
100% Y1–Y5 |
| Denise Carner, Project Staff Associate |
|
10% in Y1–Y5 |
| Erin Berical, Senior Research Support Specialist |
|
40% in Y1–Y4 |
| Jay Robohn, IT |
|
10% in Y1–Y4 |
| Rose Greene, MS, Center Director |
|
10% in Y1–Y5 |
| Graduate Research Assistants (1 position) |
|
50% in Y1–Y5 |
The UA ERI, led by Kajal Lahiri, PhD will be responsible for activities related to time series design. Dr. Lahiri will provide oversight to a graduate research assistant who will be the main support for this research. Dr. Lahiri will also plan, coordinate, and execute such analyses in coordination with Dr. Fisher.
UA ERI Staffing:
| Team Member | Task | Level of Effort (as a % of 100% or 40 hours) |
|---|---|---|
| Kajal Lahiri, PhD, Distinguished Professor and Institute Director |
|
20% in Y1–Y5 |
| Soumyadeb Chatterjee Graduate Research Assistant |
|
100% in Y1–Y5 |
Finally, subcontractors from BUSPH and UMSPH will be used to perform several functions. The role will be to lead the comparative analysis, and function as active, regular participants in the time series design and qualitative analysis. Christopher Louis, PhD will function as the lead for all subcontractors and manage/prioritize the activities of each subcontractor in collaboration with Dr. Dewar. Moreover, the team of subcontractors will collaborate with UA in the qualitative and time series components of this evaluation. For example, Dr. Louis, Roby, and Drainoni, will collaborate with the UA CHSR in survey and qualitative study design.
BUSPH and UMSPH Staffing:
| BUSPH & UMSPH Subcontractors | Task | Level of Effort (as a % of 100% or 40 hours) |
|---|---|---|
| Chris Louis, PhD, Clinical Assistant Professor |
|
30% in Y1–Y5 |
| Sally S. Bachman, PhD, Chair and Associate Professor |
|
10% in Y1–Y5 |
| TBD |
|
10% in Y1 5% in Y3–Y5 |
| TBD |
|
10% in Y1–Y2 5% in Y3–Y5 |
| Mari–Lynn Drainoni, PhD, Associate Professor and Director, CIIS |
|
10% in Y1–Y2 5% in Y3–Y5 |
| Dylan Roby, PhD, Assistant Professor |
|
20% in Y1–Y2 15% in Y3–Y4 10% in Y5 |
| Lily Chen, MD, MPH – Programmer/Data Management support |
|
20% in Y1 50% in Y2–Y4 25% in Y5 |
The figure below reflects the individuals who will participate in evaluation activities. This figure is organized according to: 1) overall evaluation project oversight and coordination, 2) time series analysis, 3) qualitative analysis and 4) comparative analysis. Some individuals may participate in more than one area, and thus, their name appears multiple times.
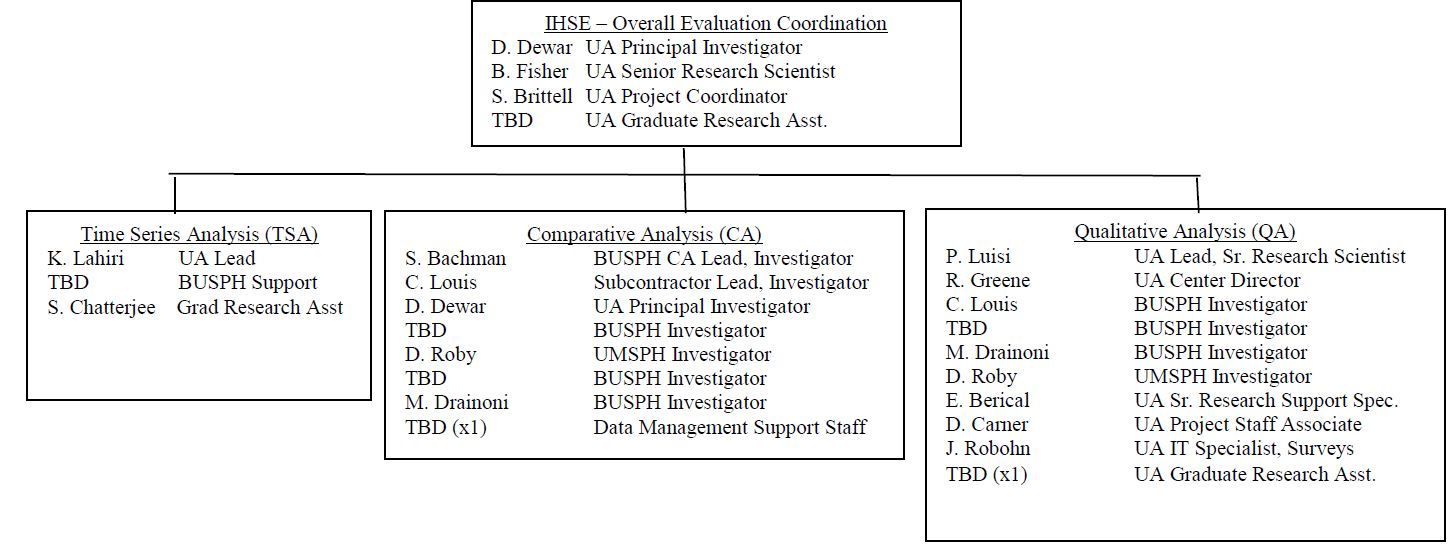
Section I:
Limitation of the Design:
NYSDOH responded in November 2017 to CMS´s request to include limitations of the design in the evaluation design. NYSDOH responded that, as part of the STC, the IE is required to use controls and adjustments for, and reporting of, the limitations of data and their effects on results. As evaluation results are reported, this will be monitored by NYSDOH.
The evaluation will leverage data from multiple sources, including available administrative data like hospital discharge records, Medicaid claims, Medicaid enrollment, DSRIP attribution and enrollment, and hospital–supplied measures. In addition, the evaluation team will obtain quarterly PPS progress report data to capture detail about PPS implementation and phase–in of programs that are likely to affect the outcomes of interest. The evaluation team will attempt to control for important independent variables at the individual–level (i.e. age, gender, race/ethnicity, attribution length, language) as well as geographic or provider–level variation. However, the IE is aware that the number of PPSs are limited and there are not sufficient degrees of freedom to accurately estimate the independent effect of the PPS using regression analyses, so they will be able to control for individual level characteristics of those nested within each PPS. The evaluation team should also be able to examine the impact of different projects or clusters of projects (if not restricted to PPS location) to assess the impact of the DSRIP´s projects on population health outcomes and spending.
Two of the key complicating factors of the New York DSRIP design are the selection of a control group of enrollees and identification of non–participating hospital or provider sites that serve as adequate comparisons for the provider participants in the DSRIP. Due to the nature of New York´s Medicaid managed care enrollment, payer mix at participating hospitals versus non– participating hospitals, and the geographic areas where PPS have been implemented, the evaluation team will explore identification of a control group using propensity score matching from non–attributed Medicaid enrollees over the same time period, and also identifying hospitals in the state that are not participating in PPS networks. That will be a challenge and exploratory analyses will be required to assess whether either method is appropriate. In this endeavor to explore the data, the IE is far more skeptical of the ability of the non–DSRIP provider world to provide adequate comparisons. The inclusion safety net and non–safety net funding criteria for DSRIP participation explicitly limited the types of providers able to participate in DSRIP, and therefore the comparison hospitals available in the state may look fundamentally different. One of the IE–team members, Dr. Dylan Roby, was a co–PI of the California DSRIP and led efforts to identify comparison hospitals to the DSRIP hospitals in the state. Despite more than 300 general acute care facilities in the state, it was virtually impossible to identify unique hospitals to act as comparison sites due to differences in operations, size, payer mix, DSH and supplemental payments, and case mix. The IE anticipates that the same problems will occur in finding non– DSRIP hospitals to serve as adequate comparisons given the "safety net" nature and reach of the DSRIP participants. Given the broad reach of the DSRIP PPS and the inclusion criteria related to Medicaid caseload required by the DSRIP, it is difficult to find appropriate comparison hospitals that look similar to the DSRIP–participating hospitals. However, the IE considers following these exploratory steps to adequately create a control group using Medicaid data, and identify comparison sites using hospital–level data and Medicaid claims.
As stated throughout the evaluation plan, the IE will employ different analytic methods for the different sections (time series, comparative, qualitative process/implementation). In all of the sections, the IE will explore the best way to select control patients from the non–Medicaid population (when making statewide comparisons in trends in utilization, spending, etc.) using exact or propensity score matching to identify Medicaid beneficiaries in New York who were not exposed to the DSRIP and can serve as adequate controls. At the same time, the IE will explore methods for selecting similar hospital/providers from Medicaid claims data that were not instrumentally impacted by the DSRIP and can serve as comparison sites for DSRIP participating hospitals/providers. The IE will explore the non–participating sites to identify potential matches using cluster analysis based upon important variables (i.e., risk mix, payer mix, size, services, etc.) and will provide feedback to the NYSDOH and CMS on feasibility. There is a second set of comparison and control groups that will be primarily used by the comparative analysis team. Rather than attempting to draw comparisons across the state among DSRIP and non–DSRIP sites, the IE will instead draw from project selections and clustering of sites around specific goals to identify within DSRIP controls (patients) and comparisons (PPS) to analyze claims, CAHPS survey, and other data sources to understand the impact of project selections and clusters of projects on patient outcome and hospital/provider metrics. The IE will use a difference–in–differences estimation methodology to examine specific performance measures in the time before and after the implementation of the DSRIP program comparing PPSs involved in specific interventions to those that were not engaged in those projects. This estimation strategy adjusts for time–based variations in outcomes, helping determine program impacts from other phenomena. Moreover, this approach will give the IE an aggregate understanding as to whether the overall picture has changed for specific domains based on key measures of interest defined in STCs Attachment J.
This approach will also require the use of risk–adjusted measures. This will be ideal because it would level the playing field in terms of the dual–eligibles and SSI patients as these individuals tend to seek care at distinct locations and are typically–high utilizers of care. Also, prior to carrying out this analysis, the IE will endeavor to identify patients and providers (hospitals and medical groups) who were not involved in any DSRIP PPS and understand the trends in use, quality, and spending over time in a separate difference–in–differences analysis.
Patient–level Comparisons. The IE will examine trends within and across PPS with respect to patient–level outcomes using claims data and NYSDOH patient CAHPS surveys. In particular, the IE will focus such comparisons on factors including age, sex, race, presence of chronic conditions, and mental health/substance abuse to inform their understanding of patients´ service experience and satisfaction during the DSRIP program. Such analyses will require the use of CAHPS data to examine patient satisfaction scores. However, because CAHPS scores/responses are typically not attributed to specific patients and are only available at the department, hospital, medical group, physician, or health plan level, the IE will need to examine the organizational– level CAHPS scores and their relationship to patient–level outcomes for populations attributed to the specific organization (at multiple levels). To effectively conduct such an analysis, the IE will build upon the approach set forth by Sequist, et al. (2008) to deal with the lack of individual– level outcome data linked to CAHPS scores.
Because the IE knows the Medicaid population can be vulnerable to income status changes and other reasons for disenrollment, they will determine inclusion criteria based upon months enrolled over each 12–month time period for specific measures (for example, HEDIS–based quality measures often require 11 months of enrollment) and gaps in coverage. When considering other measures, like spending and patient experience, all Medicaid members will be included for the months they were enrolled over the 36–month program and the 12–month look– back period for pre–DSRIP data.
|top of Section I.| |top of page|Section J:
Generalizability of Results:
NYSDOH responded in November 2017 to CMS´s request to include generalizability of results in the evaluation design. NYSDOH responded that, as part of the STC, the IE is required to discuss generalizability of results. As evaluation results are reported, this will be monitored by NYSDOH.
The comparative evaluation team, which includes Dr. Chris Louis (BU) and Dr. Dylan Roby (University of Maryland) are experts on state DSRIP interventions and the results available to date in California, New Jersey, and Texas. Dr. Roby was a co–PI of the DSRIP evaluation in California, while at UCLA. The comparative evaluation team will consider the scope, details of each DSRIP model, and explain the advantages and disadvantages of comparing other state DSRIP programs to New York´s implementation, what variation existed that might impact the overall impact of DSRIP waivers, and how findings from New York inform their understanding of DSRIP program effects overall. Evaluating the NYS DSRIP, given the multiple PPS networks, partnerships, and projects within each domain is a complex endeavor. The evaluation team will leverage both qualitative and quantitative data to inform the evaluation design by embracing the variation across and within PPS interventions and the varied goals of each. The evaluation team acknowledges that broad external factors, such as economic conditions, immigration, unemployment, Medicaid expansion decisions, and health care market factors will impact results of the DSRIP in different states, and they will address how those factors may differ and limit or help generalizability of the New York DSRIP.
|top of Section J.| |top of page|Section K:
Analysis of DSRIP Dollar Allocation:
In November 2017, NYSDOH responded to CMS´s request to include analysis of the distribution of funding both across and within PPS, including a description of how DSRIP funds were used, distribution to downstream providers, which DSRIP projects received the greatest resources, and how many patients benefited from each type of project. NYSDOH answered that the DSRIP Independent Assessor and Account Support team (Public Consulting Group [PCG]) is collecting information regarding how DSRIP funds are used. However, information regarding allocation of DSRIP funds to various providers is not available throughout the DSRIP project in a standardized fashion. This has been further considered by the IE and they will explore funds flow to various providers via the publicly available PPS Implementation Progress Plans.
Additionally, NYSDOH responded in November 2017, that the requested analysis related to patients benefiting from each type of project is outside of the scope of the IE contract and a contract amendment would not be feasible with the timely submission of the Draft Interim Evaluation Report and Preliminary Summative Evaluation Report. This has been further considered by the IE and they will explore the patient engagement information publicly available from the PPS in their quarterly Implementation Progress Plans.
|top of Section K.| |top of page|Attachment 1:
DSRIP Summary of Special Terms and Conditions (STC)
The DSRIP evaluation will be consistent with the specifications outlined in the DSRIP Special Terms and Conditions (STC), Sections VIII.21 through VIII.33, as summarized below:
Evaluation Requirements. The state shall engage the public in the development of its evaluation design. The evaluation design shall incorporate an interim and summative evaluation and will discuss the following requirements as they pertain to each:
- The scientific rigor of the analysis;
- A discussion of the goals, objectives and specific hypotheses that are to be tested;
- Specific performance and outcome measures used to evaluate the demonstration´s impact;
- How the analysis will support a determination of cost effectiveness;
- Data strategy including sources of data, sampling methodology; and how data will be obtained;
- The unique contributions and interactions of other initiatives; and
- How the evaluation and reporting will develop and be maintained.
The demonstration evaluation will meet the prevailing standards of scientific and academic rigor, as appropriate and feasible for each aspect of the evaluation, including standards for the evaluation design, conduct, and interpretation and reporting of findings. The demonstration evaluation will use the best available data; use controls and adjustments for and report of the limitations of data and their effects on results; and discuss the generalizability of results.
The state shall acquire an independent entity to conduct the evaluation. The evaluation design shall discuss the state´s process for obtaining an independent entity to conduct the evaluation, including a description of the qualifications the entity must possess, how the state will assure no conflict of interest, and a budget for evaluation activities.
Evaluation Design. The Evaluation Design shall include the following core components to be approved by CMS:
- Research questions and hypotheses: This includes a statement of the specific research questions and testable hypotheses that address the goals of the demonstration, including:
- Safety net system transformation at both the system and state level;
- Accountability for reducing avoidable hospital use and improvements in other health and public health measures at both the system and state level; and
- Efforts to ensure sustainability of transformation of/in the managed care environment at the state level.
- The design will include a description of the quantitative and qualitative study design (e.g., cohort, controlled before–and–after studies, interrupted time series, case– control), including a rationale for the design selected. The discussion will include a proposed baseline and approach to comparison. The discussion will include approach to benchmarking, and should consider applicability of national and state standards. The application of sensitivity analyses as appropriate shall be considered.
- Performance Measures: This includes identification, for each hypothesis, of quantitative and/or qualitative process and/or outcome measures that adequately assess the effectiveness of the Demonstration in terms of cost of services and total costs of care, change in delivery of care from inpatient to outpatient, quality improvement, and transformation of incentive payment arrangements under managed care. Nationally recognized measures should be used where appropriate. Measures will be clearly stated and described, with the numerator and dominator clearly defined. To the extent possible, the state will incorporate comparisons to national data and/or measure sets. A broad set of metrics will be selected. To the extent possible, metrics will be pulled from nationally recognized metrics such as from the National Quality Forum, Center for Medicare and Medicaid Innovation, meaningful use under HIT, and the Medicaid Core Adult sets, for which there is sufficient experience and baseline population data to make the metrics a meaningful evaluation of the New York Medicaid system.
- Data Collection: This discussion shall include: A description of the data sources; the frequency and timing of data collection; and the method of data collection. The following shall be considered and included as appropriate:
- Medicaid encounter and claims data in TMSIS;
- Enrollment data;
- EHR data, where available;
- Semiannual financial and other reporting data;
- Managed care contracting data;
- Consumer and provider surveys; and
- Other data needed to support performance measurement
- Assurances Needed to Obtain Data: The design report will discuss the state´s arrangements to assure needed data to support the evaluation design are available.
- Data Analysis: This includes a detailed discussion of the method of data evaluation, including appropriate statistical methods that will allow for the effects of the Demonstration to be isolated from other initiatives occurring in the state. The level of analysis may be at the beneficiary, provider, health plan and program level, as appropriate, and shall include population and intervention–specific stratifications, for further depth and to glean potential non–equivalent effects on different sub–groups. Sensitivity analyses shall be used when appropriate. Qualitative analysis methods shall also be described, if applicable.
- Timeline: This includes a timeline for evaluation–related milestones, including those related to procurement of an outside contractor, if applicable, and deliverables.
- Evaluator: This includes discussion of the state´s process for obtaining an independent entity to conduct the evaluation, including a description of the qualifications that the selected entity must possess; how the state will assure no conflict of interest, and a budget for evaluation activities.
- Executive Summary. This includes a concise summary of the goals of the Demonstration; the evaluation questions and hypotheses tested; and key findings including whether the evaluators find the demonstration to be budget neutral and cost effective, and policy implications.
- Demonstration Description. This includes a description of the Demonstration programmatic goals and strategies, particularly how they relate to budget neutrality and cost effectiveness.
- Study Design. This includes a discussion of the evaluation design employed including research questions and hypotheses; type of study design; impacted populations and stakeholders; data sources; and data collection; analysis techniques, including controls or adjustments for differences in comparison groups, controls for other interventions in the state and any sensitivity analyses, and limitations of the study.
- Discussion of Findings and Conclusions. This includes a summary of the key findings and outcomes, particularly a discussion of cost effectiveness, as well as implementation successes, challenges, and lessons learned.
- Policy Implications. This includes an interpretation of the conclusions; the impact of the demonstration within the health delivery system in the state; the implications for state and federal health policy; and the potential for successful demonstration strategies to be replicated in other state Medicaid programs.
- Interactions with Other State Initiatives. This includes a discussion of this demonstration within an overall Medicaid context and long–range planning, and includes interrelations of the demonstration with other aspects of the state´s Medicaid program, and interactions with other Medicaid waivers and other federal awards affecting service delivery, health outcomes and the cost of care under Medicaid.
Interim Evaluation Report. The state is required to submit a draft Interim Evaluation Report 90–days following the completion of DY 4 of the demonstration. The Interim Evaluation Report shall include the same core components as identified for the Summative Evaluation Report (below) and should be in accordance with the CMS approved evaluation design. CMS will provide comments within 60 days of receipt of the draft Interim Evaluation Report. The state shall submit the final Interim Evaluation Report within 30 days after receipt of CMS´s comments.
Summative Evaluation Report. The Summative Evaluation Report will include analysis of data from DY 5. The state is required to submit a preliminary summative report in 180 days of the expiration of the demonstration including documentation of outstanding assessments due to data lags to complete the summative evaluation. Within 360 days of the end for DY 5, the state shall submit a draft of the final summative evaluation report to CMS. CMS will provide comments on the draft within 60 days of draft receipt. The state should respond to comments and submit the Final Summative Evaluation Report within 30 days.
The Final Summative Evaluation Report shall include the following core components:
State Presentations for CMS. The state will present to and participate in a discussion with CMS on the final design plan at post approval. The state will present on its interim evaluation report (described above). The state will present on its summative evaluation (described above).
Public Access. The state shall post the final approved Evaluation Design, Interim Evaluation Report, and Summative Evaluation Report on the State Medicaid website within 30 days of approval by CMS.
CMS Notification. For a period of 24 months following CMS approval of the Summative Evaluation Report, CMS will be notified prior to the public release or presentation of these reports and related journal articles, by the state, contractor or any other third party. Prior to release of these reports, articles and other documents, CMS will be provided a copy including press materials. CMS will be given 30 days to review and comment on journal articles before they are released. CMS may choose to decline some or all of these notifications and reviews.
Electronic Submission of Reports. The state shall submit all required plans and reports using the process stipulated by CMS, if applicable.
Cooperation with Federal Evaluators. Should CMS undertake an evaluation of the demonstration or any component of the demonstration, or an evaluation that is isolating the effects of DSRIP, the state and its evaluation contractor shall cooperate fully with CMS and its contractors. This includes, but is not limited to, submitting any required data to CMS or the contractor in a timely manner and at no cost to CMS or the contractor.
Cooperation with Federal Learning Collaborative Efforts. The state will cooperate with improvement and learning collaboration efforts by CMS.
Evaluation Budget. A budget for the evaluation shall be provided with the evaluation design. It will include the total estimated cost, as well as a breakdown of estimated staff, administrative and other costs for all aspects of the evaluation such as any survey and measurement development, quantitative and qualitative data collection and cleaning, analyses, and reports generation. A justification of the costs may be required by CMS if the estimates provided do not appear to sufficiently cover the costs of the design or if CMS finds that the design is not sufficiently developed.
Deferral for Failure to Provide Summative Evaluation Reports on Time. The state agrees that when draft and final Interim and Summative Evaluation Reports are due, CMS may issue deferrals in the amount of $5,000,000 if they are not submitted on time to CMS or are found by CMS not to be consistent with the evaluation design as approved by CMS.
|top of Attachment 1| |top of page|
Follow Us