DSRIP Breakthrough Webinar Series
- Webinar is also available in Portable Document Format (PDF)
Big and Small Data:
Driving Change at the Practice and Patient Level
Megan Dormond
Data and Evaluation Analyst, Practice Improvement
Shannon Mace
Director, Practice Improvement
Jeff Capobianco
Director, Practice Improvement
Aaron Surma
Senior Associate, CIHS
The National Council for Behavioral Health
February 2016
Webinar Overview
- Explain the difference between data, information, and knowledge.
- Explain how measuring process and outcome variables can lead to more effective care provision and a more predictable and satisfying work flow.
- Identify common physical and behavioral health quality metrics and the components necessary to measure a process and produce an outcome metric.
- Define population health management and identify the four steps required to conduct effective population health management.
- Explain how to link level of care determination to service utilization and cost.
- Identify the internal mechanisms and staff competencies necessary to implement these concepts.
Why does data measurement matter?
"If you are not measuring a process, you don´t know what you are doing."
"If you are not measuring processes, you can´t improve."
"If you are not measuring processes, you are operating blindly and therefore are at risk for delivering ineffective and wasteful care at best."
If you are not measuring your care provision and administrative processes, you cannot achieve the triple aim of population health management, cost containment and customer centered care … in other words, survive in the healthcare marketplace today.
Data, Information, and Knowledge
What is data?
- Granular or unprocessed information
(e.g., one A1c lab value or PHQ 9 measurement)
What is information?
- Information is "big data" that have been organized, measured and communicated in a coherent and meaningful manner
(i.e., take multiple A1c lab vales or PHQ 9 scores)
What is knowledge?
- Information evaluated and organized so that it can be used purposefully
(e.g., electronic medical record dashboards)
What is the ultimate purpose of collecting and sharing data?
To turn it into action!
(a.k.a. Continuous Quality Improvement)
| Data | ➨ | Information | ➨ | Knowledge | ➨ | Action |
|---|
Process vs. Outcome
Process Measure Answers:
How does the system work? (e.g., # or % patients who smoke are offered smoking cessation services or took a PHQ9)
Outcome Measure Answers:
What is the final product, or results? (e.g., # or % of patients who stop smoking or moved from clinically high to clinically normal A1c lab value)
Take home?
- Use risk cutoffs as an evaluation tool (e.g., 100% of diabetics should have an A1c below 7%) and process measures (e.g., 100% smokers should be offered smoking cessation treatment).
- Always consult a trained evaluator when designing evaluation studies.
The Clinical Pathway and Staff Workflow
The Clinical Pathway
Where evidence–based, best or promising clinical practices and administrative processes are expressed in the staff workflow
and
Where the consumer´s treatment / recovery plan is expressed in his / her life everyday
What is a Workflow?
- An orchestrated and repeatable pattern of clinical and administrative staff behaviors designed to drive clinical and administrative processes and outcomes.
- In other words, the behavioral patterns / routines staff engage in everyday when they come to work.
Variation = Waste = Poor and Expensive Care
- The degree to which a clinic / practice can work as a team and standardize clinical and administrative processes to reduce variation and waste will determine the quality of care provision and financial sustainability of the clinic
- Measuring processes and resulting outcomes is the only way to determine if a process is efficient and effective (or variable and wasteful)
Measuring the Components
Evidence–based / Best / Promising Practice
+ Treatment and Care Process Targets
+ Standardized Clinical / Administrative Workflow
_____________________________________________________________________________
= Actionable information in the form of Clinical and Administrative Outcome Metrics
Common Measures
Physical Health:
- Blood Pressure & A1c Levels
- Cardiac Lipids
- Body Mass Index (BMI)
Behavioral Health:
- PHQ–9
- GAD–7
- Substance Use (e.g., Smoking & Alcohol Use)
Choosing a Good Metric / Key Performance Indicator
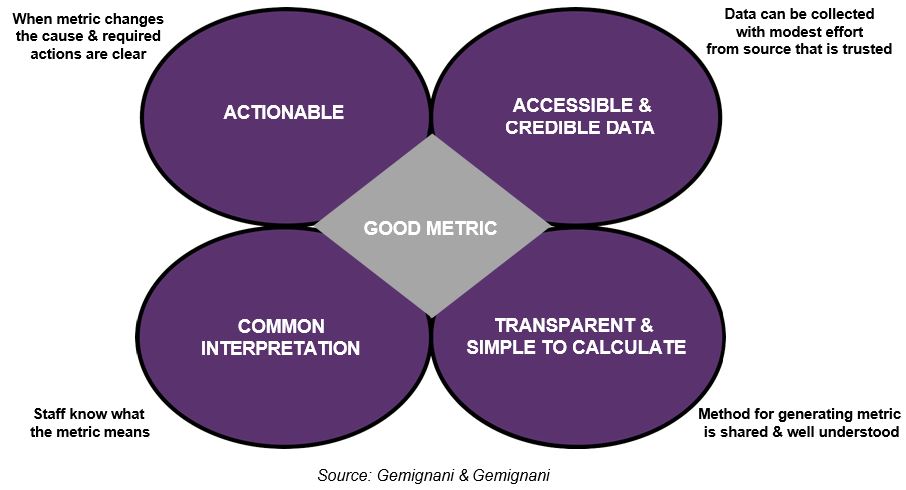
Population Health Management Measures
Must Have Specifications
The measure specifications will provide the following:
- Brief measure description
- Definition of measure numerator
- Definition of measure denominator
- Exclusions to measure, if applicable
- Description of report periods
- Tables detailing the diagnosis and billing codes
Defining Population Health Management
- A set of interventions designed to maintain and improve people´s health across the full continuum of care–from low–risk, healthy individuals to high–risk individuals with one or more chronic conditions
(Source: Felt–Lisk & Higgins, 2011) - Population management requires providers to develop the capacity to utilize data to choose which patients to select for specific evidence–based interventions and treatments
(Source: Parks, 2014)
Population Health Management
- Strategies for optimizing the health of an entire client population by systematically assessing, tracking, and managing the group´s health conditions and treatment response.
- It also entails approaches to engaging the entire target group, rather than just responding to the clients who actively seek care.
Components of Population Health Management:
- Knowing what to ask about your population
- Data registry describing your population
- Engage in CQI Process to respond to the findings
- Use Dashboards for making data understandable
What are the questions you want answers to about your populations?
- Who are you serving? Who are you not serving but could / should be?
- What are the costs for the average patient?
- What kind of services are they getting; where, and when?
- What is the patient´s response to treatment?
- What is the patient´s opinion of his / her care?
Components of Population Health Management:
- Knowing what to ask about your population
- Data registry describing your population
- Engage in CQI Process to respond to the findings
- Use Dashboards for making data understandable
Patient Registry
"…an organized system to collect uniform data (clinical and other) to evaluate specified outcomes for a population defined by a particular disease, condition, or exposure, and that serves one or more predetermined scientific, clinical, or policy purposes."
Source: Gliklich RE, Dreyer NA, eds. (2010).
Registries for Evaluating Patient Outcomes: A User´s Guide. 2nd ed.
Registry Examples
- Provider Excel / ACCESS DB (simplest)
- Managed Care Portals
- Electronic Medical Records
- Health Information Exchanges (typically do not have registries)
Components of Population Health Management:
- Knowing what to ask about your population
- Data registry describing your population
- Engage in CQI Process to respond to the findings
- Use Dashboards for making data understandable
Using QI Process to Respond to the Data Findings
"Quality improvement in public health is the use of a deliberate and defined improvement process, such as Plan–Do–Check–Act, which is focused on activities that are responsive to community needs and improving population health."
"It refers to a continuous and ongoing effort to achieve measurable improvements in the efficiency, effectiveness, performance, accountability, outcomes, and other indicators of quality in services or processes which achieve equity and improve the health of the community."
This definition was developed by the Accreditation Coalition Workgroup (Les Beitsch, Ron Bialek, Abby Cofsky, Liza Corso, Jack Moran, William Riley, and Pamela Russo) and approved by the Accreditation Coalition on June 2009.
Components of Population Health Management:
- Knowing what to ask about your population
- Data registry describing your population
- Engage in CQI Process to respond to the findings
- Use Dashboards for making data understandable
What is a Dashboard?
A dashboard translates your organization´s strategy into metrics that provide timely information and insights that enable staff to proactively improve decisions, optimize processes, and plans.
In short it, enables staff to monitor, analyze, and manage their work.
Source: Performance Dashboards: Measuring, Monitoring, & Managing Your Business. 2nd Edition 2011 Wayne Eckerson
How to use a Dashboard
Monitoring: Convey information at a glance
Analysis: Identify exceptions and drill down to details
Management: Improve alignment, coordination, and collaboration
Source: Performance Dashboards: Measuring, Monitoring, and Managing Your Business. 2nd Edition 2011 Wayne Eckerson
Dashboards
- Should allow the data to tell a story about the people you serve and the care provided
- Should be "simple" to start – target only a few key aspects of population and their care
- Make the display simple – eliminate unnecessary clutter
Basic Dashboard
Aggregate Data: Key Data Points at a Glance
Data included represents results from all ages as of September 30, 2015
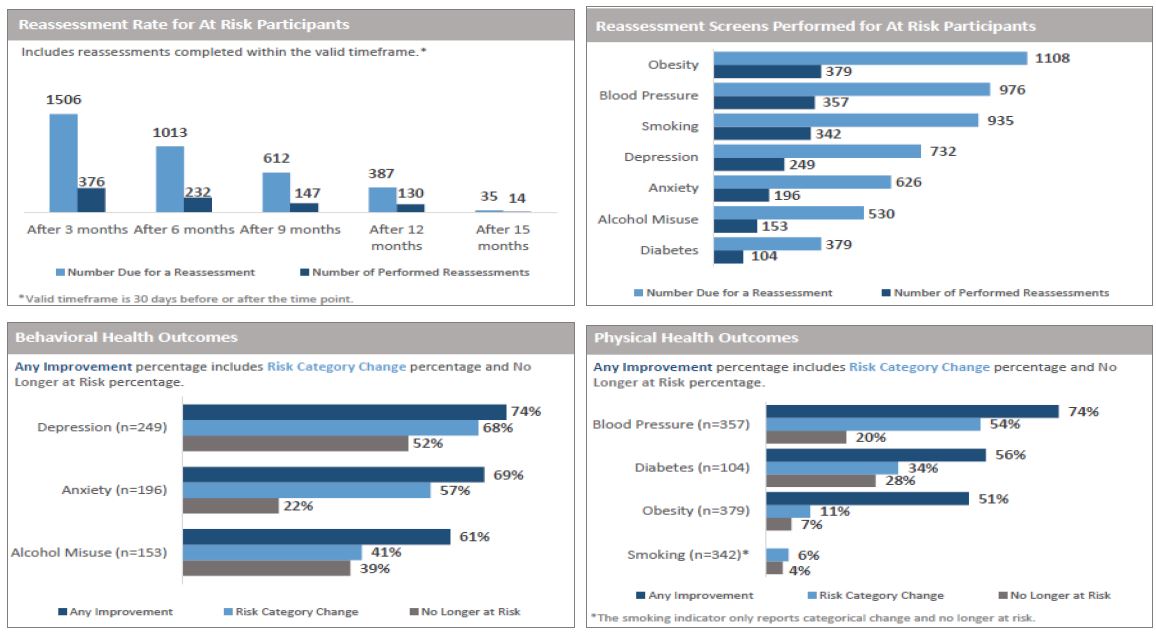
Dashboard Data Elements
- Cost: Service Utilization, Case Rates, etc.
- Operations: No Shows, Insurance Mix, etc.
- Staff Work Plan: Performance on Scope of Practice Tasks
- Clinical: Labs, Assessment / Screening Results, Vitals, etc.
- Care Coordination: Medication Reconciliation, etc.
- Benchmark Comparisons: Between Organizations, Clinicians, Teams, etc.
- Risk Cutoffs: Reveal when data are out of specification (e.g., A1c > 6)
That´s nice…but…
- Our EMR doesn´t have a registry component to help with PHM!
- We don´t have an EMR…yet!
- Our IT staff are hard to engage with helping with this!
- Okay I´m sold, but where do we start? How do we design this?
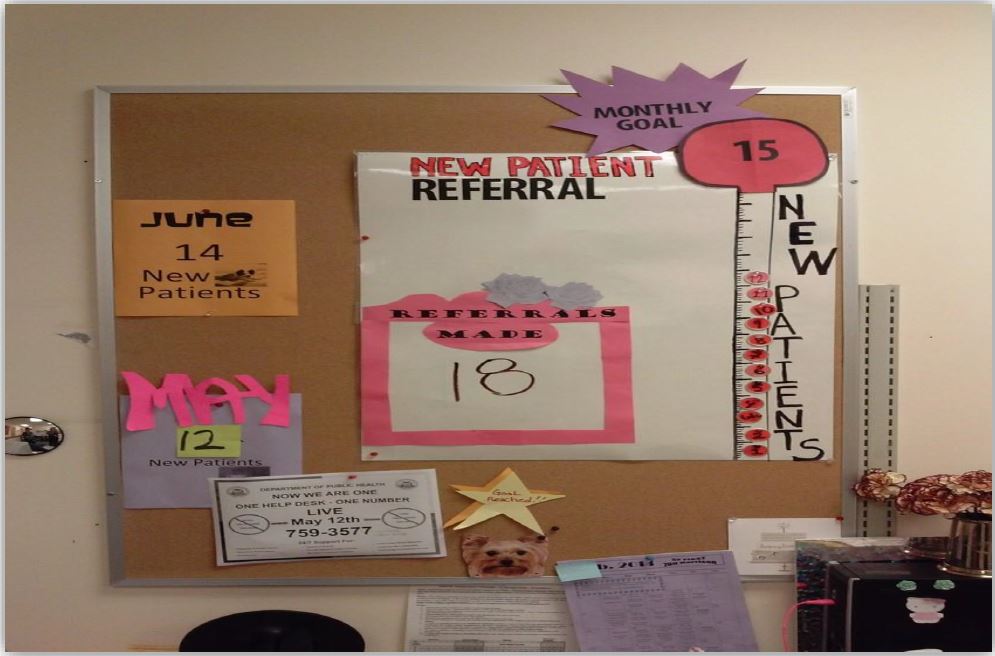
Basic Dashboard
Linking Quality Metrics to Cost:
The Next Frontier
Simple Bundling Logic Model
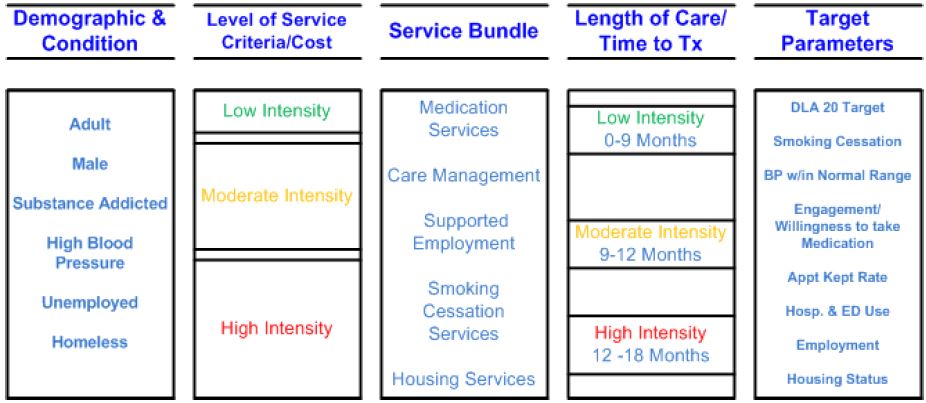
Case Rate Example
Choose Condition: High Blood Pressure (BP)
Define Population: Diagnosis, Screening / Assessment Scores
Define Services: BP Screening at intake / quarterly; Referral and Coordination with Primary Care and Pharmacy
Episode Length of Time: 9 months
Calculate Cost: How much on average would it cost to treat this episode of care?
[Total Cost divided by (Number of Patient Days in an Episode × Number of Patients)] × 365
Total Cost for High BP Care Coordination: $50,000
Number of Patient Days in an Episode: 180
Number of Patients: 100 per year
Case Rate Per Member Per
Day: $3
Month: $84
Year: $1,014
Source: Adapted from R. Manderscheid; Talk Titled: Introduction to Case Rates & Capitation Rates
|top of section| |top of page|Internal Mechanisms
D for accessible, high–quality Data
E for an Enterprise orientation
L for analytical Leadership
T for strategic Targets
A for Analyticaltalent
Source: Davenport, Harris & Morison, Analytics at Work: Smarter Decisions Better Results
Further Reading and Resources
Felt–Lisk, S. & Higgins, T. (2011). Exploring the Promise of Population Health Management Programs to Improve Health.
Mathematica Policy Research Issue Brief.
Parks, J., et al. (2014) Population Management in the Community Mental Health Center–based Health, Center for Integrated Health Solutions Homes
(Great resource on everything integration)
(Website detailing what is happening with health reform in each state)
(Website focused on publicly funded healthcare and the transformations underway)
(Updates on the ACA for professions–great site to sign up for email notices)
Population Health Management: A Roadmap for Provider–Based Automation in a New Era of Healthcare; Institute for Health Technology Transformation
CREEPING AND LEAPING FROM PAYMENT FOR VOLUME TO PAYMENT FOR VALUE:
Seven Steps to Performance–based Services Acquisition/Contracting
CMS Innovation Center: Health Care Payment Learning and Action Network
|top of section| |top of page|Thank you!
Jeff Capobiano
jeffc@thenationalcouncil.org
Aaron Surma
Aarons@thenationalcouncil.org
Megan Dormond
megand@thenationalcouncil.org
Shannon Mace
shannonm@thenationalcouncil.org

Follow Us