Occupational Fatalities in New York State: 2003 and 2004 Update
"Occupational Fatalities in New York State: 2003 and 2004 Update" is available in Portable Document Format (PDF, 1MB, 4pg.)
From 2003 through 2004, there were 280 traumatic work-related deaths reported in New York State, excluding New York City1. These largely preventable fatalities represent enormous emotional and financial costs to both families and society. Information on fatal occupational injuries is collected by the New York State Department of Health (NYSDOH) through the Census of Fatal Occupational Injuries (CFOI) program2 and the Fatality Assessment and Control Evaluation (FACE) program3. The purpose of these programs is to identify contributing factors to occupational fatalities in order to facilitate the development of effective traumatic injury prevention/intervention strategies.
This update provides an overview of fatal occupational injury events in New York State1 for the years 2003 and 2004. Information is presented on employee status, sex, age, and race; the events that caused the fatalities; and occupation and industry. Synopses of NYSDOH FACE reports are also included.
Fatal Occupational Injuries, 2003 and 2004
- The vast majority of occupational fatalities involved men (91.8%); however 12 females died on the job in 2003- the largest number of females fatally injured in a single year since 1994.
- While wage and salary workers represent the largest percentage of occupational fatalities (66.4%), nearly 30% of fatally injured workers were self-employed or working in a family business.
- The largest number of deaths occurred among those aged 45-54 (63 fatalities or 22.5%); however, nearly one-quarter of fatally injured workers were age 55 and over (68 fatalities or 24.3%). Four workers under age 20 were also fatally injured during the two-year period.
- Approximately 81% of occupational fatalities were among Whites. Fatal injuries to Hispanic/Latino workers comprised the next largest percentage with 7.1% of the occupational fatalities recorded over the two-year period.
- Transportation accidents exceeded all other fatal events with 42.5% of occupational fatalities.
- Fatal incidents to those working in transportation and material moving occupations represent the largest percentage of total fatalities (25.4%) followed by incidents to those working in construction and extraction occupations (16.4%). Similarly, the construction and transportation/warehousing industries exceeded all other industries in occupational fatalities with 18.2% and 13.9%, respectively.

Demographics
As shown in Table 1, fatal injuries to wage and salary workers accounted for the largest number of occupational deaths (186 fatalities, 66.4%) in New York State1 in 2003 and 2004. Self-employed and family business workers accounted for the next largest number with 80 fatalities (28.6%), although this group represents only 11.2% of the upstate NY labor force. The leading causes of death among the self-employed/family business workers were transportation accidents (30.0%) and assaults and violent acts (30.0%). Over one-quarter (27.5%) of self-employed/family business workers were working in agriculture, forestry, and fishing industries.
The vast majority of occupational fatalities involved men (91.8%); however 12 females died on the job in 2003- the largest number of females fatally injured in a single year since 1994. Of the 23 women fatally injured on the job in 2003 and 2004, 11 (47.8%) were killed in transportation accidents and nine (39.1%) were killed as a result of assaults and violent acts.
Older workers, those age 55 and over, experienced a disproportionate percentage of work-related fatalities. Although this group of workers represents 17.7% of the upstate NY labor force, nearly one-quarter of fatalities occurred to workers in this age group (68 fatalities, 24.3%).
The majority of occupational fatalities involved White workers (80.7%) followed by Hispanic/Latino workers (7.1%).
| N(%) | |
|---|---|
| Total | 280(100) |
| Employee Status Wage & salary workers Self-employed/family business Armed Forces Volunteer |
186(66.4) 80(28.6) 11(3.9) 3(1.1) |
| Sex Male Female |
257(91.8) 23(8.2) |
| Age <20 20-24 25-34 35-44 45-54 55-64 65-74 75+ |
4(1.4) 27(9.6) 56(20.0) 62(22.1) 63(22.5) 43(15.4) 18(6.4) 7(2.5) |
| Race White Hispanic/Latino Black Asian Other/Unknown |
226(80.7) 20(7.1) 17(6.1) 6(2.1) 11(3.9) |
Event/Exposure
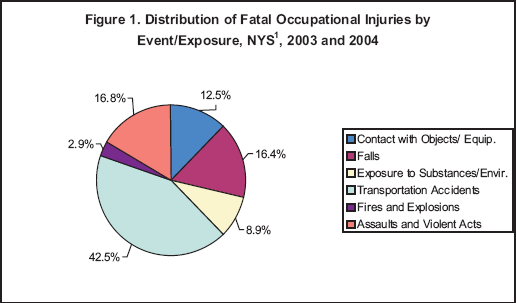
As previouly seen during the period of 1992-2002, transportation accidents continue to lead all other events, accounting for 42.5% of traumatic occupational fatalities (Figure 1). Half (51.3%) of these transportation accidents were highway accidents; an additional 23.5% involved workers being struck by vehicles or mobile equipment.
Slightly under half (46.2%) of transportation accidents occurred to workers in transportation and material moving occupations. Truck drivers represented the largest category of workers who were fatally injured in transportation accidents with 33 fatalities over the two-year period.
NY FACE INVESTIGATION 03NY036: A 41-year-old truck driver was delivering cardboard sludge to a recycling plant when he was fatally crushed between the tailgate of his dump truck and the rear of a payloader. He had completed dumping the cardboard waste onto an outdoor unloading pad and had pulled a short distance away to secure the tailgate of his truck. As he was securing the tailgate, a payloader backed out of an adjacent storage building in order to move the waste. Unaware of the dump truck, the payloader operator backed towards the truck, crushing the victim between the two vehicles.
In order to help prevent similar incidents from occurring in the future, NY FACE recommended that unloading procedures be modified to promote safety; truck drivers pull trucks a safe distance away from the unloading area prior to securing the tailgate; payloader operators survey the area prior to backing; and safety devices be checked at each shift change to ensure proper operation.
In addition to highway vehicles, transportation accidents related to tractors played a role in New York State occupational fatalities over the two-year period. In 2003 and 2004, nine workers were fatally injured in farming-related tractor accidents. Five of these individuals (55.6%) were over age 55.
Following transportation accidents, the next largest event categories for the two-year period were assaults and violent acts and falls (with 16.8% and 16.4% of fatalities, respectively). Twenty-five falls were reported in 2004- the largest number ever recorded in a single year by NYS CFOI. Nearly half of these (48.0%) were workers in construction and extraction occupations. In the assaults and violent acts category, eighteen homicides were reported in 2004- the largest number reported in a single year since 1995.
Occupation/Industry
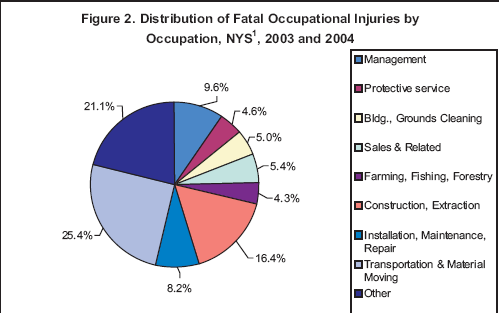
As shown in Figure 2, transportation and material moving occupations represented the largest percentage of total fatalities (25.4%) followed by those working in construction and extraction occupations (16.4%). Slightly over half of the accidents in these occupational categories involved vehicles (53.8%) while an additional 19.7% involved structures and surfaces.
Fatal injuries to those working in managerial occupations represented the third largest occupational category with 27 fatalities (9.6%) over the two-year period. The majority of these were agricultural managers, including farmers and ranchers (16 fatalities, 59.3%). Nine of these managers (56.3%) were over age 55.
NY FACE INVESTIGATION 04NY077: A 76-year-old dairy farmer was fatally injured when the tractor he was operating overturned. The farmer had been moving hay bales from a field using a hay wagon pulled by the tractor. As the farmer drove the tractor-wagon down a sloping farm lane, the weight of the loaded wagon overcame the tractor, causing the tractor to jack-knife. After the tractor-wagon connector broke, the tractor skidded to the side and overturned, pinning the farmer underneath.
In order to help prevent similar incidents from occurring in the future, NY FACE recommended that the weight of tractor/trailer combinations be properly matched to ensure safe towing operation; all agricultural tractors be equipped with rollover protective structures (ROPS) and a seatbelt; and tractor brakes be routinely inspected and maintained for uniform operation.
In terms of industry (not shown), the construction industry exceeded all others in fatal work-related injuries (18.2% of fatalities) followed by those working in the transportation/warehousing industry (13.9% of fatalities).
Occupational Fatality Reporting
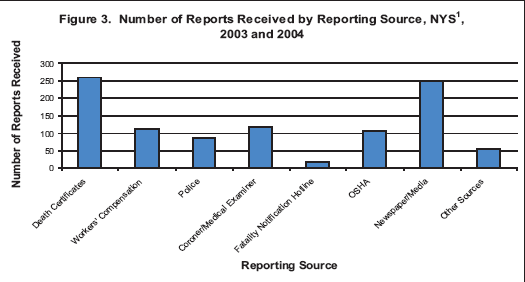
The NY CFOI and FACE programs utilize multiple sources to identify, verify and profile occupational fatalities (Figure 3). Multiple sources are used in order to enable both programs to provide as complete and accurate information concerning workplace fatalities as possible. As shown in Figure 3, death certificates and newspaper/ media reports are the most common sources of fatality information.
Further information about the New York State Department of Health CFOI and FACE programs, as well as complete NY FACE reports, can be obtained on-line at:
If you know of a work-related death, you should report it to the New York State Department of Health at: 1-866-807-2130 (toll free)
1. NYS data does not include New York City fatalities. New York City collects and analyzes data separately.
2. In cooperation with the US Department of Labor, Bureau of Labor Statistics.
3. In cooperation with the National Institute for Occupational Safety and Health.
