Occupational Fatalities in New York State, 2007-2008
- Acknowledgement
- Executive Summary
- Chapter 1. Background
- Chapter 2. Worker Characteristics
- Chapter 3: Events/Exposures
- Chapter 4. Industry
- Chapter 5: Occupation
- Summary
- References
Acknowledgement
This report would not be possible without the cooperation of local, state and federal agencies that provide the source documents to identify and verify New York State (NYS) fatal occupational injuries. Among these agencies are the county coroners and medical examiners, local police departments and sheriffs' offices, hospitals and emergency rooms, the NYS Police, the NYS Workers' Compensation Board, the NYS Division of Vital Records, the U.S. Occupational Safety and Health Administration, the National Transportation Safety Board, and the U.S. Mine Safety and Health Administration.
The NYS Department of Health (NYS DOH) thanks these agencies for their continued support and cooperation in helping NYS DOH's Bureau of Occupational Health and Injury Prevention (BOHIP) collect data on fatal occupational injuries and illnesses.
The Department of Health also acknowledges the U.S. Department of Labor, Bureau of Labor Statistics, and the National Institute for Occupational Safety and Health for the financial assistance provided to complete this work.
This report is dedicated to all workers who have lost their lives as a result of an occupational injury or illness.
This report is based upon fatality data collected by the NYS DOH for 2007 and 2008. The data reflect the terrible price paid by so many workers who put their lives at risk. Every day in the United States, 13 people on average go to work and never come home. Every day people die as a result of workplace-related incidents. A few dramatic cases receive public attention, but most deaths from work-related causes go largely unnoticed. These preventable tragedies devastate families and workplaces. Behind the data lie deeply personal tragedies. We mourn the loss of lives, extend condolences to families and friends of the victims, and honor their memories.
The NYS DOH hopes its work will help prevent such tragedies. The challenge is to provide awareness accompanied by engagement: to learn from the loss, to develop recommendations for actions to prevent similar incidents and to work toward safer workplaces for all.
Bureau of Occupational Health and Injury PreventionCenter for Environmental Health
NYS Department of Health
Executive Summary
There were 262 work-related deaths in New York State (NYS), excluding New York City (NYC), in 2007 and 2008. This represents an 8.4 percent decrease from 2005-2006. The 123 deaths reported in 2008 were the lowest annual number since 2001. They represent an 11.5 percent decline from 2007, when there were 139 occupational fatalities. The NYS fatality rate for all workers averaged 2.58 deaths per 100,000 workers for 2007-2008. The NYS fatalities account for 2.4 percent of the 10,871 work-related deaths in the United States during 2007 and 2008. Recommendations for the prevention of fatal events are provided in case reports and prevention materials through the New York Fatality Assessment and Control Evaluation program.
Worker Characteristics
- 80.5 percent of fatalities were White, non-Hispanic workers.
- Fatal injuries to Hispanic/Latino immigrants increased to 11 percent of all occupational fatalities from 8 percent for 2005-2006.
- People who were 45-54 years of age had the most occupational fatalities with 69 fatalities or 26.3 percent of deaths. The primary events in this age group were transportation accidents, assaults and violent acts, and falls.
- Workers greater than 65 years of age accounted for 41 or 15.6 percent of fatalities, more than twice the 19 deaths (6.6 percent) in 2005-2006.
- Government workers accounted for 34 deaths or 13 percent of fatalities, with 73.5 percent of them in the local government sector. The primary events were transportation, followed by falls and exposures to harmful substances.
- 60 percent of foreign-born worker fatalities and 72 percent of Hispanic/Latino foreign-born worker fatalities occurred in Suffolk, Nassau and Westchester counties.
Events, Industries and Occupations
- Transportation incidents were the most frequent fatality events, accounting for 88 deaths or one-third of all fatalities.
- Workplace suicides doubled from 2007 to 2008.
- The top three industries sustaining fatalities in NYS for 2007 and 2008 were construction, transportation and warehousing, and agriculture, forestry, fishing and hunting.
- Fatalities in the agriculture, forestry, fishing and hunting sector nearly doubled from 2007 to 2008, primarily due to increased logging incidents.
- The manufacturing industry's decline in fatalities paralleled its decline in the number of employed workers. The total number of fatal occupational injuries in manufacturing for 2007-2008 approached the total in 2006 alone.
- Loggers had the highest fatality rate of any occupation in NYS in 2007-2008 with 262 deaths per 100,000 workers. This is 100 times the average fatality rate of 2.58 per 100,000 for all NYS workers.
- In 2007-2008, all roofer fatalities were due to falls from elevations – heights ranging from 12 to 42 feet. The deaths account for another high fatality rate in NYS, at 77.5 deaths per 100,000 workers.
Chapter 1: Background
New York State is the third most populous state in the United States with more than 19 million persons in 62 counties. Population densities range from urban centers to rural, wilderness settings. With just under 9 million full-time workers, the workforce and industries also are diverse. Industries include manufacturing; construction and retail trades; mining, oil and gas extraction; transportation; and agriculture, forestry, fishing and hunting.
The state is frequently divided into two regions for analytical purposes:
- New York State excluding New York City (all regions of the state excluding New York City)
- New York State including New York City, which is composed of Bronx, Kings, New York, Queens and Richmond counties.
This report addresses fatal occupational injuries in NYS, excluding the five counties of NYC, where 5.3 million workers (60 percent of full-time workers) reside.
Approximately 387,000 workers, or 14 percent of the NYS workforce (excluding NYC), are employed in industries at high risk for occupational mortality – those with fatality rates higher than 10 deaths per 100,000 workers. These high-risk industries include but are not limited to the construction and the agriculture, forestry, fishing and hunting industries.
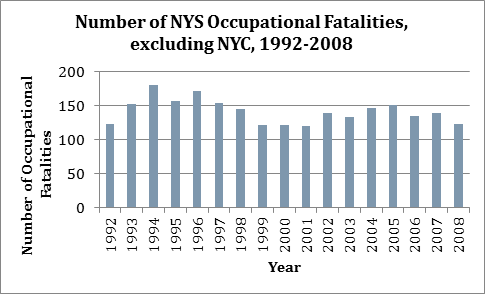
Since 1992, 138 workers on average die each year in NYS from occupational injuries. There were 262 work-related deaths in NYS in 2007 and 2008, an 8.4 percent decrease from 2005-2006. The 123 deaths in NYS in 2008 are the lowest number of annual deaths in NYS outside NYC since 2001 and represent an 11.5 percent decline from the 139 fatalities in 2007, The U.S. Department of Labor's Bureau of Labor Statistics (BLS) proposed that economic factors likely played a role in the decline, due to decreases in employment and in the number of hours worked.1
The NYS fatality rate for all workers averaged 2.58 deaths per 100,000 workers for 2007-2008. The NYS fatalities account for 2.4 percent of the 10,871 work-related deaths in the United States during 2007 and 2008.
Information on how and where these fatal injuries occur is essential to developing effective prevention strategies. The NYS DOH has two programs that address fatal injuries at work:
- New York State Census of Fatal Occupational Injuries (NYS CFOI)
- New York Fatality Assessment and Control Evaluation (NY FACE).
New York State Census of Fatal Occupational Injuries
The New York State Census of Fatal Occupational Injuries (NYS CFOI), part of the BLS Occupational Safety and Health Statistics Program, compiles a count of all work-related injury fatalities occurring during each calendar year, including self-employed workers, agricultural workers, government employees, wage and salary workers and those working in family businesses. The NYS CFOI program uses diverse data sources to identify, verify and describe fatal work injuries. This assures counts are as complete and accurate as possible.
NYS DOH has been implementing this census for NYS, excluding NYC, since 1992. This federal-state cooperative program is partially supported by BLS. NYS CFOI data are combined with data from other states, cities and territories to generate BLS national statistics on fatal injuries at work.
The report data represent occupational fatalities from injury-related fatalities. The requirements are:
- The incident must have occurred in NYS;
- The death must have occurred during the calendar year in the analysis period;
- The death must be work-related as defined by NYS CFOI criteria.
The NYS CFOI monitors and verifies all fatal work injuries by collecting information on the circumstances of each fatality and on the characteristics of each decedent. This census helps to determine the workers at greatest risk of being killed on the job and the most common cause of fatal injuries at work. Included in the count are unintentional injuries such as falls, electrocutions and motor vehicle crashes, as well as intentional injuries at work (homicides and suicides).
NYS CFOI data are obtained from coroner and medical examiner reports; death certificates; autopsy and toxicological reports; reports from the National Transportation Safety Board; news media; Mine Safety and Health Administration (MSHA); Occupational Safety and Health Administration (OSHA); law enforcement as well as Motor Vehicle Accident reports; NYS Workers' Compensation Board reports; and any other source that may substantiate a case. For the 2007 and 2008 data, more than 1,500 unique source documents were reviewed.
NYS CFOI data are used for research and statistical analysis and to develop prevention measures. The data are intended to support employers, researchers, government agencies, or anyone interested in promoting workplace safety and injury prevention and to assist the development of specific training for occupations with the highest likelihood of fatalities. The NYS CFOI data are also used by the NY FACE program.
New York Fatality Assessment and Control Evaluation
New York State is one of nine cooperative state partners funded by the CDC's National Institute for Occupational Safety and Health (NIOSH) to investigate fatal occupational injuries. NIOSH has established national targets for conducting investigations, including deaths associated with machinery, youth under 18 years of age, Hispanic workers, and street/highway construction work zone fatalities. New York Fatality Assessment and Control Evaluation's (NY FACE) state targets include the agriculture industry and older workers.
The goal of NY FACE is to learn more about the factors that contribute to fatal occupational injuries and to use this information to develop and disseminate educational materials for preventing similar deaths. NY FACE activities reflect the priorities identified by the NYS CFOI fatal injury data. In-depth investigations are conducted throughout the state of a select number of the fatal incidents to determine the associated causes and risk factors. By studying these conditions, recommendations are developed for effective ways employers and employees can prevent fatal injuries.
Case reports include recommendations for the prevention of fatal injuries through methods that include engineering controls and safer work practices. Reports and prevention materials are distributed to stakeholder agencies and organizations , as well as occupational safety and health professionals. The investigation reports are also used as the basis for fact sheets or hazard alerts known as "FACE Facts", which are broadly disseminated throughout the state (www.health.ny.gov/environmental/investigations/face/).
Illness Related Fatalities
This report describes work-related injury fatalities. The NYS DOH also collects data on a subset of illness-related fatalities related to events at work, such as when a decedent is stricken by a heart attack, stroke or other illness while engaged in work-related activities.
Many factors contribute to heart attacks and other illnesses, making it difficult to establish a clear relationship to the workplace. Therefore, illnesses are classified separately for the purpose of this report. In all 85 cardiovascular or cerebrovascular events at work were identified for 2007 and 2008.
- The age range of decedents was 17 to 96.
- Twelve deaths were due to heart attacks in firefighters.
- Ages ranged from 44 to 82, with an average of 65.9 years.
- Seven decedents were older than age 65, with an average of 76.7 years.
- Five decedents were less than age 65, with an average of 50.8 years.
- The federal Centers for Disease Control and Prevention (CDC) has documented heart attacks related to the strenuous work involved in firefighting.
- Ten deaths were recorded in the illness category for truck drivers.
- Ages ranged from 44 to 66 years, with an average of 56.5 years.
- Research has shown that the occupation of truck driver exposes workers to heart attacks due to the sedentary nature of the occupation.
Chapter 2: Worker Characteristics
Fatalities by Gender
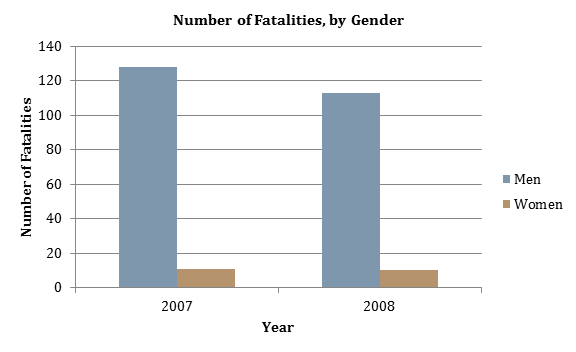
Though women were employed in equal numbers to men in NYS in 2007 and 2008, men were 11.5 times more likely to be killed on the job than women. BLS data show that men dominate in the occupations with high fatality rates, such as 97 percent of construction workers, 97 percent of firefighters, and 73 percent of police officers. The share of male deaths has remained constant at about 92 percent in NYS CFOI data since 1992. There were 241 men fatally injured at work in 2007 and 2008, a 5.9 percent decline from 2005-2006.2
For 2007 and 2008, there were 21 deaths among women, or 8 percent of the total fatalities. This is a 30 percent decrease from the 30 female fatalities reported in 2005-2006. The 2005 high of 17 deaths was the largest number of females fatally injured in a single year in NYS, excluding NYC, since the census was started in 1992. More than half the female deaths were in two categories. Transportation events were the cause of eight deaths, or 23 percent of female deaths; assaults and violent acts caused five deaths, or 23.8 percent of fatalities in this category.
| Characteristic | All Occupations, 2007* | All Occupations, 2008* | Total* | Percentage** |
|---|---|---|---|---|
| 18 to 19 years | 3 | --- | 3 | 1.1 |
| 20 to 24 years | 13 | 5 | 18 | 6.9 |
| 25 to 34 years | 21 | 16 | 37 | 14.1 |
| 35 to 44 years | 20 | 29 | 49 | 18.7 |
| 45 to 54 years | 34 | 35 | 69 | 26.3 |
| 55 to 64 years | 24 | 17 | 41 | 15.6 |
| 65 years and over | 21 | 20 | 41 | 15.6 |
| * Some data do not meet CFOI publishing criteria or the data may not be available. As a result, the columns do not add to the total number of fatalities. ** Percentages are based on all 262 fatalities for 2007-2008. |
||||
Fatalities by Age
The age group 45-54 years had the most occupational fatalities by age categories, with 69 fatalities or 26.3 percent of deaths in 2007-2008. The primary events were transportation accidents, assaults and violent acts, and falls.
As in 2005-2006, workers aged 35-54 represented nearly half the occupational fatalities for 2007-2008.
In 2007-2008, there were changes in young worker and older worker demographics:
- For workers under 20 years of age, deaths declined to only 1 percent. In 2005-2006, there were nine deaths under the age of 20 years, or 3.1 percent of the fatalities in those years.
- Workers older than 65 years of age accounted for 15.6 percent of fatalities. This is up from 6.6 percent of deaths in 2005-2006, as more New Yorkers over the age of 65 remain in the workforce. BLS census statistics indicate that this demographic trend is expected to continue.3
| Characteristic | All Occupations, 2007* | All Occupations, 2008* | Total* | Percentage** |
|---|---|---|---|---|
| White, Non-Hispanic | 112 | 99 | 211 | 80.5 |
| Black, non-Hispanic | 9 | 7 | 16 | 6.1 |
| Hispanic/Latino | 17 | 12 | 29 | 11.1 |
| Asian | --- | 3 | 3 | 1.1 |
| * Some data do not meet CFOI publishing criteria or the data may not be available. As a result, the columns do not add to the total number of fatalities. ** Percentages are based on all 262 fatalities for 2007-2008. |
||||
Fatalities by Race
In 2007-2008, 80.5 percent of all fatalities were White, non-Hispanic workers.
The 17 fatalities for Hispanic/Latino workers in 2007 was the highest number recorded in a year since data collection began in 1992. The data show a 29 percent drop to 12 occupational fatalities in 2008, mirroring the 17 percent decrease in BLS national data. The fatality rate for Hispanic/Latino workers for 2007 and 2008 is 3.36 deaths per 100,000 workers. Hispanic/Latino workers experience a higher fatality rate than other minority groups nationally as well.
All Hispanic/Latino workers who died in 2007 and 2008 were immigrants, primarily from El Salvador, Ecuador and the Dominican Republic. Together, immigrants from these countries accounted for 15 of the 29 fatalities (51.7 percent) of Hispanic/Latino foreign-born workers. While BLS national data reflect that 70 percent of foreign-born Hispanic fatalities were born in Mexico4, only two NYS fatalities were Mexican immigrants. Other decedents were from Guatemala, Columbia, Argentina and Brazil.
Employment Status
Private sector wage and salary workers accounted for 59.9 percent of all fatalities in 2007-2008, but there was a drop of 21.6 percent from 2007 to 2008 in the top two industry sectors.
- Trade, transportation and utilities deaths were 25.2 percent of 2007 fatalities (35 of 139 deaths), but dropped to 13.8 percent of 2008 fatalities (17 of 123).
- Construction deaths dropped from 15.8 percent in 2007 (22 of 139 deaths) to 8.1 percent in 2008 (10 of 123).
The construction data mirror BLS national data that showed fatal work injuries declined in private construction by 19 percent from 2007 to 2008.5
Self-employed worker fatalities increased from 31 in 2007 (22.3 percent) to 40 deaths (32.5 percent) in 2008.
- The agriculture, fishing, forestry and hunting industry was the primary industry contributing to fatalities, accounting for 30 of the 71 deaths in the self-employed category or 42 percent. This industry includes logging.
- The trade, transportation and utilities industry accounted for 9 of the 71 fatalities in 2007 and 2008 (12.7 percent).
Government or public sector workers represented 13 percent of worker fatalities in 2007 and 2008 with 34 deaths.
- 73.5 percent or 25 deaths were in local government positions which included the following (all categories are not shown):
- Highway, street and bridge construction (9)
- Justice, public order and safety activities, including police (8)
- Educational and health services (8)
- Events that contributed to the causes of these deaths included:
- Struck-by transportation events (5)
- Falls (3)
Foreign-Born Workers
There were 53 foreign-born workers among the 262 total occupational fatalities in 2007-2008. In addition to the 29 Hispanic/Latino foreign-born fatalities, there were 5 Canadian, 3 Italian, as well as workers from Jamaica, Guyana, India, Sudan, Israel, China, Finland, United Kingdom, Korea, Greece, Romania, Germany, Poland, Ireland and Yemen.
While foreign-born workers represent 20.2 percent of all NYS fatalities in 2007-2008, the causes of death for certain events were disproportionate to the populations.
- 50 percent of all drowning events (3 of 6)
- 30.8 percent of all assault and violent events (12 of 39)
- 29.2 percent of all falls events (14 of 48)
These three categories of events were the leading causes of foreign-born worker fatalities, accounting for 54.7 percent of all foreign-born worker fatalities.
The leading occupations that were associated with foreign-born worker fatalities were:
- Truckers (9)
- Landscaping services (6)
- Taxi drivers (5)
- Roofers (4)
- Construction laborers (4)
These occupations together accounted for 52.8 percent of all foreign-born worker fatalities.
County of Death
There were seven counties with greater than 10 occupational fatalities in 2007-2008:
- Suffolk (34)
- Westchester (23)
- Nassau (20)
- Erie (15)
- Monroe (12)
- Onondaga (12)
- Orange (10)
There were six counties that had no occupational fatalities in 2007-2008:
- Chautauqua
- Cortland
- Fulton
- Hamilton
- Herkimer
- Seneca
Suffolk, Nassau and Westchester counties have the largest populations, as well as the largest foreign-born and Hispanic/Latino populations, and also sustained the largest number of work-related deaths.
- 29.4 percent (77) of the 262 fatalities in 2007-2008 occurred in these counties.
- 60 percent of foreign-born worker fatalities occurred in these three counties.
- 72 percent of Hispanic foreign-born worker fatalities occurred in these counties.
The next three counties with the highest number of fatalities in 2007-2008 were Erie, Monroe and Onondaga.
These six counties accounted for 116 of the 262 (44 percent) total fatalities. However, they accounted for 78 percent of all foreign-born fatalities and 88 percent of all Hispanic foreign-born fatalities. Erie, Monroe and Onondaga counties follow population profiles for fourth, fifth and sixth in the state; Hispanic and foreign-born populations in these counties each rank in the top eight in the state.
Chapter 3: Events/Exposures
An event or exposure in the work environment describes the manner in which the injury was produced or inflicted by the source of the injury. Examples may include a fall from a ladder, violence by a person, or exposure to gases in a confined space.
| Event/Exposure | Total* | Percentage** | ||
|---|---|---|---|---|
| Transportation | 88 | 33.6 | ||
| Contact with objects or equipment | 60 | 22.9 | ||
| Falls | 48 | 18.3 | ||
| Assaults and violent acts | 39 | 14.9 | ||
| Exposure to harmful substances or environments | 11 | 4.2 | ||
| Fires and explosions | 5 | 1.9 | ||
| * Some data do not meet CFOI publishing criteria or the data may not be available. As a result, the columns do not add to the total number of fatalities. ** Percentages are based on all 262 fatalities for 2007-2008. |
||||
Transportation
Workplace fatalities involving transportation accounted for 33.6 percent of all on-the-job fatalities in 2007 and 2008 (88 of 262 deaths). Motor vehicle collisions were the primary contributor. Overall, highway fatalities are the leading cause of death for workers on the job in NYS.
NY FACE, Transportation Investigation Report
Fatality Summary
A 59-year-old female newspaper carrier was killed in a head-on collision with a car driven by a deputy sheriff. The incident occurred on a two-lane highway, just north of an area where the highway crested. The victim was traveling south in the northbound lane, placing newspapers in curbside mailboxes. The deputy sheriff was on the evening shift responding to an emergency call driving north on the same highway with his emergency lights activated. Because of the obstruction of the hill and the vehicle speeds, neither driver had sufficient time to react to avoid the collision. The victim was not wearing a seat belt and was pronounced dead at the scene.
Recommendations for Employers and Contractors
- Instruct newspaper delivery personnel NOT to drive on the wrong side of roadways while delivering.
- Instruct newspaper carriers to use their seat belts whenever the vehicles are in motion.
- Require newspaper carriers to use high-visibility strobe lights on delivery vehicles.
The complete report, photographs and figures can be found at www.health.ny.gov/environmental/investigations/face/docs/07ny092.pdf
Contact with Objects or Equipment
There were 60 fatalities due to contact events in 2007-2008, accounting for the second leading event for work-related fatalities at 22.9 percent of all fatalities.
- 60 percent (36) of the fatalities in this category were caused when the victim was struck-by an object or equipment, such as:
- Trees (20)
- Crane booms/arms (3)
- Wooden beams, steel plates, rolls of paper, veneer beams, boxes, poles, overhead doors, SUVs, rocks
- 30 percent (18) of the fatalities were the result of a caught-in or compressed-by equipment or objects event, such as:
- Augers (3)
- Dump trucks, backhoes, conveyor belts, corn pickers, snow blowers, lathes, hoof trimming machinery, front end loaders, trampling by crowd
- 5 percent (3) of the fatalities were the result of being caught-in or crushed by collapsing materials.
Fifty-nine of these 60 fatalities were men; 88.3 percent were White. Wage and salary workers accounted for 61.7 percent of these fatalities; 38.3 percent were self-employed workers. Entanglement of clothing (coat, shirt, etc.) resulted in eight fatalities. The top three industries were:
- Natural resources and mining (20)
- Trade, transportation and utilities (10)
- Professional and business services (7)
NY FACE, Contact with Objects Investigation Report
Fatality Summary
An equipment operator was fatally injured by a metal lock ring propelled from a multi-piece rim wheel on a tire he was inflating on a loader. The victim and a co-worker were preparing their loaders to remove snow from a shopping mall parking lot. The victim noticed that his left front tire, mounted on a multi-piece wheel, was underinflated. He asked his co-worker to put air in the tire. A few minutes after inflating the tire, using a hand-held pressure gauge, the victim stated the air pressure in the tire was about 15-20psi, well below the recommended pressure under such conditions. In such circumstances, OSHA requires the tires to be completely deflated, and the tire assembly to be dismounted from the vehicle, disassembled, inspected and reassembled prior to inflation. The victim took none of those actions and continued inflating the tire. The co-worker sitting in his cab heard a loud noise. He found the victim lying on the ground, apparently struck in the head by the lock ring propelled from the tire assembly. The victim was airlifted to a trauma center where he died two days later.
Recommendations for Employers
- Develop, implement and enforce a standard operating procedure (SOP) for inflating multi-piece rim wheels that requires only trained workers to service or inflate multi-piece rim wheels.
- Ensure that all equipment operators receive training and demonstrate competency on the SOP.
- Provide an air hose that has an in-line pressure gauge and sufficient hose to allow workers to stay out of the trajectory of wheel parts when inflating a tire.
The complete report and photographs can be found at www.health.ny.gov/environmental/investigations/face/docs/07ny137.pdf
Falls
NY FACE, Falls Investigation Report
Fatality Summary
A self-employed master stonemason died after falling 30 feet to the ground from the upper tier of a handmade, wooden two-tiered work platform. The work platform was fabricated by the victim and a co-worker and was fastened to the forks of a powered industrial truck. The victim had been applying a stucco finish to an addition and painting metal trim at the edge of the roof from the upper tier. The front guardrails on the upper tier were not in place. The victim was not wearing any fall protection. Safety procedures were not in place regarding entry/exit procedures and tie-offs.
Recommendations for Employers and Contractors
- Strictly follow the manufacturers' instructions and never use any powered industrial trucks as man-lifts or equip them with any personnel work platform, if they are not so designed.
- Require that powered industrial trucks are not modified or authorized to be modified in any way.
- Develop and implement a fall protection plan that includes training and equipment requirements to protect all employees who may work at heights six feet or more from the ground or lower story.
The complete report and photographs can be found at www.health.ny.gov/environmental/investigations/face/docs/07ny107.pdf
There were 48 fatalities due to falls in 2007 and 2008, accounting for the third leading event for work-related fatalities at 18.3 percent of all fatalities. Falls events decreased 40 percent from 2007 (30) to 2008 (18).
- Falls to a lower level accounted for 88.9 percent of all fall events in 2007 and 93.3 percent of all fall events in 2008.
- 50 percent of all falls were in the construction trades, occurring while workers were performing residential construction activities.
- 100 percent of roofing contractor fatalities was due to falls.
- 75 percent of falls in the government (public) sector occurred at the local government level at elementary and secondary schools (3 of 4 events). Falls were the cause of 28.6 percent of all fatalities in the government sector.
- 42.9 percent of manufacturing industry fatalities were due to falls (3 of 7 events)
- Six falls occurred in the transportation industry sector as a result of falls from nonmoving vehicles.
BLS national CFOI data show that falls from elevation were at a record high in 2007, which is a 39 percent increase since 1992.6 National data also showed a 20 percent decline in 2008.7
Assaults and Violent Acts
NY FACE, Assaults and Violent Acts-Occupational Fatality Alert
Fatality Summary
A 48-year-old dairy farmer was loading cattle onto a trailer using a chute made of fencing and portable gates. One cow suddenly turned and pushed the barn gate into the farmer. A metal protrusion on the gate punctured the farmer's heart.
The NY FACE brochure, Fatal Injuries Among Animal Handlers in New York State, is illustrative of fatalities that are considered to be assaults and violent acts. It was targeted for injury prevention among workers such as dairy farmers, beef producers, race track workers and veterinarians.
Recommendations for Animal Handlers
- Provide workers with the knowledge of animal behaviors and habits (list included in the full brochure)
- Provide employee training in the hazards associated with animal handling and offer safe handling techniques (methods for handling animals are listed in the full brochure)
- Design, construct and maintain a safe animal handling facility (factors to consider are outlined in the full brochure)
The complete report can be found at www.health.ny.gov/environmental/investigations/face/docs/03ny040.pdf
There were 39 fatalities due to assault and violent acts in 2007-2008, the fourth leading event for work-related fatalities at 14.9 percent of the total. NYS CFOI data reported a doubling in suicides from three in 2007 to six in 2008. In 2007, homicides rose 13 percent from 2006, and then declined 5.9 percent in 2008.
- 23 victims (59 percent) were wage and salary workers; 16 (41 percent) were self-employed or government workers
- 59 percent were White victims, 17.9 percent were Hispanic/Latino workers, 10 percent were Black.
- Primary age group: 45-54 years
- Leading industry group: service sector
- Causes of death:
- Shootings (18 or 46 percent)
- Taxi drivers, chauffeurs, and tow truck drivers (6)
- Law enforcement and security guards (4)
- Food service and delivery workers (3)
- Retail sales (3)
- Suicides (9 or 23 percent)
- Correctional officers, retail shop owners and workers, attorneys, caretakers, and laborers
- Assaults by animals (4 or 10 percent)
- Farmers and veterinarians
- Stabbings (3 or 8 percent)
- Others include landlords beaten by tenants and police offers assaulted and killed.
- Shootings (18 or 46 percent)
BLS national data show 2008 as the highest number of deaths by suicide, up 28 percent from 2007. Workplace homicides declined 18 percent in the U.S. from 2007 to 2008.8
Chapter 4: Industry
"Industry" represents the industrial group in which the decedent was employed. The 2002 North American Industry Classification System (NAICS) is used to classify workers into the industry category that is their primary work environment. The industries have been collapsed into broad categories for this report.
Construction
NY FACE, Construction Industry Investigation Report
Fatality Summary
A construction worker died after falling off a collapsed precast concrete floor slab at a 10-story construction site. The victim and a co-worker were on the sixth floor using pry bars to adjust the precast floor slabs into their final position. As they walked on the slab, the slab suddenly tilted downward and rotated to a near-vertical position. The victim fell to the floor below. The tilted slab then fell and struck the victim. The slab crashed through the cement slab floor below, and the victim fell through the opening created by fallen slabs, landing on the third floor. A number of steel columns, including the ones in the collapsed zone, were erected out of plumb. This led to increased spacing between the columns and reduced support for the slabs located between the columns.
Recommendations for Employers and Contractors
- Comply with the structural dimensions and tolerances specified by the erection design and correct any misalignments of the frame before erecting precast slabs.
- Ensure that workers use personal fall protection arrest systems.
- Provide employees with training on the prevention of fall hazards.
- Quality control procedures should be implemented to ensure that proper tolerances are maintained by all trades involved in a project.
NOTE: The Precast/Pre-stressed Concrete Institute (PCI) incorporated NYFACE recommendations in its technical safety manual.
The complete report and photographs can be found at www.health.ny.gov/environmental/investigations/face/docs/07ny015.pdf
Traditionally, the construction sector is associated with a high number of job-related fatalities. The industry is labor intensive, working environments are frequently changing, and many parties may be involved on a worksite.
There were 41 fatalities in the construction industry in 2007-2008, making it the leading industry for worker fatalities in NYS with a rate of 5.8 deaths per 100,000 workers. However, worker fatalities dropped 48 percent from 2007 (27 fatalities) to 2008 (14 fatalities).
- The sector employs 4.1 percent of the workforce but experiences a disproportionate percentage of all traumatic occupational fatalities at 15.6 percent.
- 30 (73 percent) of the fatalities were related to residential construction activities
- 11 (27 percent) of the fatalities were non-residential construction.
Transportation and Warehousing
The transportation and warehousing sector includes industries providing transportation of passengers and cargo, warehousing and storage of goods, scenic and sightseeing transportation, and support activities such as routine repair and maintenance of air, rail, water, road, and pipeline transportation equipment. Many establishments in this sector operate on networks, with physical facilities, labor forces and equipment spread over an extensive geographic area. This industry category is separate and distinct from the events category called "transportation." Transportation events signify the manner in which occupational injuries or illnesses were produced or inflicted.
There were 40 fatalities in this industry in 2007-2008, making it the second-highest sector for work-related fatalities in NYS, just behind the construction industry. Fatalities declined by 40 percent from 2007 to 2008.
Agriculture, Forestry, Fishing and Hunting
There were 37 fatalities in the agriculture, forestry, fishing, and hunting industry in 2007-2008, making it the third-highest sector for work-related fatalities in NYS.
While deaths declined from 2007 to 2008 in the construction industry and in the transportation and warehousing industry, fatalities in the agriculture, forestry, fishing, and hunting industry increased 31.3 percent, from 16 to 21 deaths.
- The increase was primarily related to the logging sector.
- The agriculture, forestry, fishing, and hunting industry was the leading industry for worker fatalities in 2008.
Chapter 5: Occupation
The occupation section is the occupational group in which the decedent was employed. The 2000 Standard Occupation Classification (SOC) system is used to classify workers into one of 840 detailed occupations, which have been collapsed into larger categories for this report.
Loggers
Twelve workers died in 2007 and 2008 in the occupation category of logger. This represented 4.6 percent of all fatalities.
- BLS employment numbers for NYS logging occupations indicate that this occupation represents only 0.03 percent of the workforce.
- The fatality rate in NYS for loggers was 267 deaths per 100,000 workers, making logging the occupation with the highest fatality rate in NYS. This compares to the national BLS fatality rate for loggers of 82 per 100,000 workers.1
Landscapers
Landscapers and groundskeepers may also engage in logging and tree-related work, using chain saws, tree trimmers and other equipment. There were an additional 13 workers in landscaping and grounds maintenance occupations that sustained fatalities performing tree-related work.
- The fatality rate for landscapers was 25.1 deaths per 100,000 workers.
- Though lower than the logging fatality rate, it still is a disproportionate number of fatalities based on NYS employment numbers.
- There were 25 fatalities for logger and lanscaper occupations.
- 15 deaths were a result of "contact with object" events.
- Trees were the primary or secondary source of contact in 14 of these 15 events.
- Four of the 25 fatalities were due to falls.
Farmers
Twelve farmers died in 2007-2008 in New York State. Farmers are categorized in multiple occupational categories, making it difficult to separate the employment data for calculation of fatality rates.
Causes of the 12 fatalities included falls, contact with animals, rollover of farm vehicles, pinning by tractors, and being struck by moving farm vehicles.
Roofers
Ten workers died in 2007-2008 in this occupation category, representing 3.8 percent of all fatalities.
- BLS employment numbers indicate that the NYS roofing occupation represents only 0.08 percent of the workforce.
- The fatality rate in NYS for roofers was 77.5 deaths per 100,000 workers, one of the highest fatality rates of any occupation.
- All roofers died from falls from roof edges (six deaths), ladders, roof surfaces, or openings. Heights ranged from 12 to 42 feet.
Summary
Conclusion
Work-related fatalities are not fated. Incidents don't just happen; they are caused. Most are preventable. Continued efforts are needed to promote safety at work, improve safety cultures, and increase awareness, engagement and recommendations for action in the groups at highest risk.
The findings presented here are intended to provide guidance to industry, labor and community organizations as well as government and research groups to develop and implement strategies to prevent similar incidents.
NYS DOH has used the NYS CFOI data in its efforts to increase awareness and to provide recommendations for prevention activities. For example,
- Hispanic/Latino foreign-born workers have the highest rate of worker fatality by race. NYS DOH has translated 'Face Facts" publications into Spanish.
- The logging occupation has among the highest fatality rates and is a primary focus for NYS DOH prevention activities.
- The NYS DOH publication "Logging Safety: A Field Guide" has been well-received by key partners, including the NYS Office of Parks, Recreation and Historic Preservation, as well as the Game of Logging and Timber Talk safety training groups.
- OSHA compliance officers have distributed the NYFACE information in investigations and training.
- "FACE FACTS: Tree Trimming" was included in the quarterly NYS DOH media packet to health educators and local public health departments.
- NYS DOH issued a press release on the publication "Chainsaw Safety for Homeowners" to alert the public to safety hazards associated with post-storm cleanup activities.
Further information about the NYS DOH, NYS CFOI and NY FACE programs, including complete NYFACE reports, may be found online at:
Please report work-related fatalities to the NYS Department of Health, Bureau of Occupational Health and Injury Prevention, Census of Fatal Occupational Injuries, 518-402-7900.
References
- 1 U.S. Department of Labor, Bureau of Labor Statistics, National Census of Fatal Occupational Injuries in 2008.
- 2 New York State Department of Health. Occupational Fatalities in New York State: 2005 and 2006 update.
- 3 Toosi, Mitra. Labor force projections to 2018: Older workers staying more active. Labor Force Employment Outlook. Monthly Labor Review. November 2009.
- 4 Centers for Disease Control and Prevention. MMWR. Work-Related Injury Deaths Among Hispanics – United States 1992-2006.
- 5 Bureau of Labor Statistics. Census of Fatal Occupational Injuries. Distribution of fatal work injuries by selected occupations in the private construction industry, 2007-2008, Page 20.
- 6 EHS Today. Census of Fatal Occupational Injuries Shows a Decline in Worker Deaths. August 19, 2008.
- 7 EHS Today. BLS Data Shows Decline in Worker Deaths in 2008. August 24, 2009.
- 8 Economic News Release. Census of Fatal Occupational Injuries Summary, 2008.
