Guidance for Health Outcome Data Review and Analysis Relating to NYSDEC Environmental Justice and Permitting
Appendix B - Calculating Confidence Intervals
A basic spreadsheet such as Microsoft's Excel can be used to calculate confidence intervals using standard equations found in many epidemiology textbooks. This is especially useful if you will be repeating the calculation numerous times. There are also many web based statistical calculators which can calculate confidence intervals, although the results may vary slightly depending on which method is used. While Excel does have the capability to calculate a number of descriptive statistics and statistical functions itself, including confidence intervals, many of these assume you have access to the raw data needed to calculate the variance and standard deviation. Since we are only given the either the observed and expected cases or rates among the local and comparison populations, preprogrammed spread sheets with formulas that allow the user to calculate confidence intervals can be used without having all of the data points. Selection of the appropriate spreadsheet will depend on how your data are organized and the measure around which the confidence interval is being developed. So far there are two specific types of examples that have been given, asthma rates and cancer incidence. Each one needs to be approached slightly differently; however, the same general formula can be applied to both. The confidence limits are based on the Byar's approximation of the exact Poisson distribution which is extremely accurate even with small numbers (Breslow and Day, 1987).

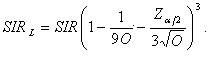
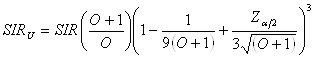
SIR = Standardized Incidence Ratio
O = Observed number of cases
E = Expected number of cases
Za/2 = Value of the standard normal distribution for a given significance level (alpha).
(For a 95% confidence interval alpha = 0.05 and Za/2 =1.96)
Access preprogrammed spreadsheets here, and follow the instructions below.
- Cancer Incidence: For cancer data the expected rates have already been calculated and the observed rates for an area are supplied. Thus all that you need to do to calculate the standardized incidence ratio (SIR - the ratio to the observed vs expected number of cases), is to enter the observed and expected numbers in the spreadsheet for your area of concern. The spread sheet will calculate the standardized incidence ratio SIR and generate 95% confidence intervals.
- Asthma Hospitalizations: For asthma (and other) hospitalization data we are comparing two rates against each other using a rate ratio (RR - the ratio of the local hospitalization rate to a comparison area's rate). We have information on the number of hospitalizations and the population size for each area. With this information the rates per 100,000; the rate ratio; and its corresponding confidence interval can be calculated. The same equations can be used simply by applying the comparison area's hospitalization rate to the local population size to determine the expected number of cases. However, to calculate an expected number for the standardized (age-adjusted) rate in the final row it will be necessary to weight each age group and sum the individual age specific expected values. The formula for this is given below. The spreadsheet automatically makes these calculations plus it calculates the overall age-adjusted rate ratio for the comparison.
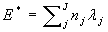
E* = Age-adjusted expected number of cases
nj = Local population of age group j
λj = Hospitalization rate of comparison population in age group j
